By Helgi Library - May 7, 2024
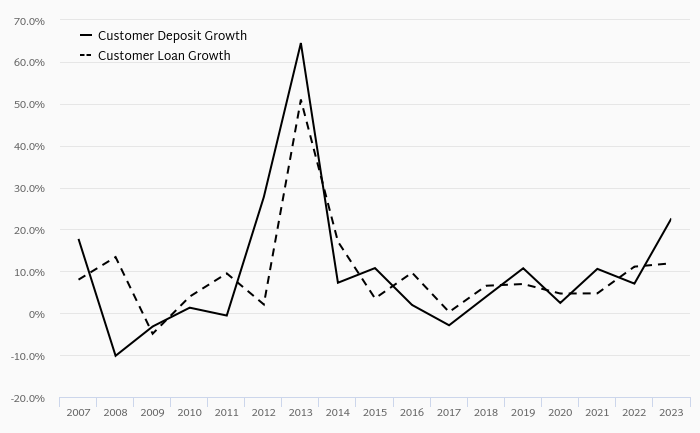
Air Bank's customer loans reached CZK 95,865 mil in 2023-09-30, up 7.23% compared to the previous year. Czech banking sector pr...
By Helgi Library - May 7, 2024
Air Bank made a net profit of CZK 524 mil under revenues of CZK 1,508 mil in the fourth quarter of 2023, down 8.01% and 5.29%...
By Helgi Library - May 7, 2024
Air Bank made a net profit of CZK 524 mil in the fourth quarter of 2023, down 8.01% when compared to the same period of last year...
| Profit Statement | 2021 | 2022 | 2023 | |
| Net Interest Income | CZK mil | 3,742 | 7,115 | 7,176 |
| Net Fee Income | CZK mil | 589 | 463 | 586 |
| Other Income | CZK mil | 95.0 | 671 | 747 |
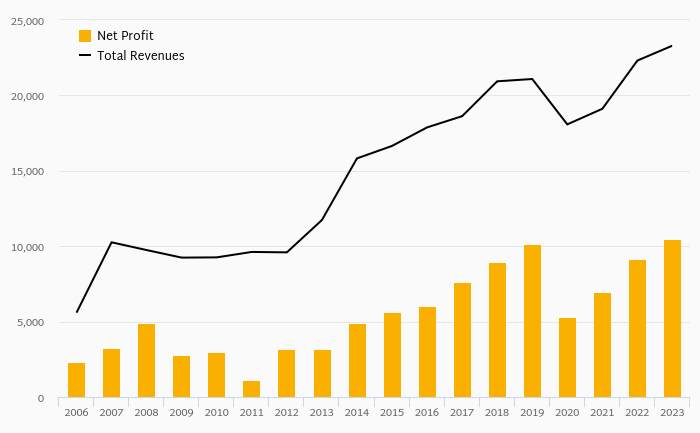
| Total Revenues | CZK mil | 4,426 | 8,249 | 8,509 |
| Staff Cost | CZK mil | 828 | 1,478 | 1,686 |
| Operating Profit | CZK mil | 2,188 | 4,762 | 4,657 |
| Provisions | CZK mil | -73.0 | 1,008 | 1,525 |
| Net Profit | CZK mil | 1,862 | 2,947 | 2,549 |
| Balance Sheet | 2021 | 2022 | 2023 | |
| Interbank Loans | CZK mil | 2,691 | 0 | 0 |
| Customer Loans | CZK mil | 67,497 | 80,456 | 94,710 |
| Investments | CZK mil | 40,617 | 36,686 | 38,089 |
| Total Assets | CZK mil | 146,998 | 153,773 | 160,994 |
| Shareholders' Equity | CZK mil | 12,583 | 12,536 | 11,383 |
| Interbank Borrowing | CZK mil | 0 | 6,992 | 8,037 |
| Customer Deposits | CZK mil | 129,320 | 129,010 | 135,824 |
| Issued Debt Securities | CZK mil | 278 | 1,599 | 1,789 |
| Ratios | 2021 | 2022 | 2023 | |
| ROE | % | 16.0 | 23.5 | 21.3 |
| ROA | % | 1.31 | 1.96 | 1.62 |
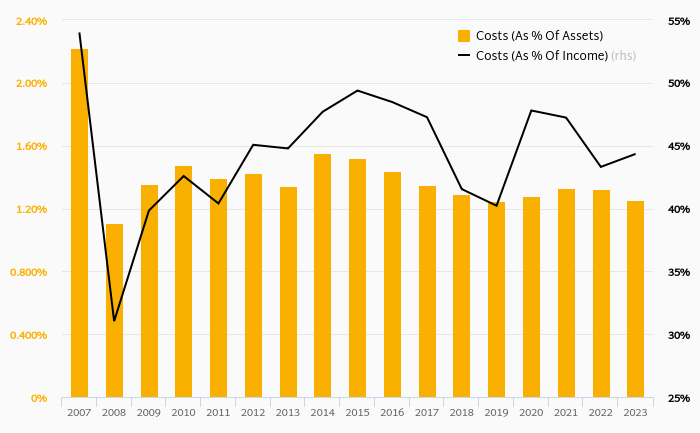
| Costs (As % Of Assets) | % | 1.57 | 2.32 | 2.45 |
| Costs (As % Of Income) | % | 50.6 | 42.3 | 45.3 |
| Capital Adequacy Ratio | % | 18.2 | 16.6 | 15.8 |
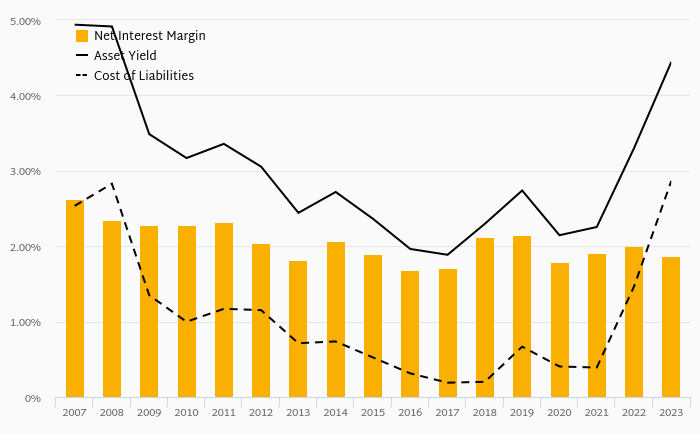
| Net Interest Margin | % | 2.63 | 4.73 | 4.56 |
| Loans (As % Of Deposits) | % | 52.2 | 62.4 | 69.7 |
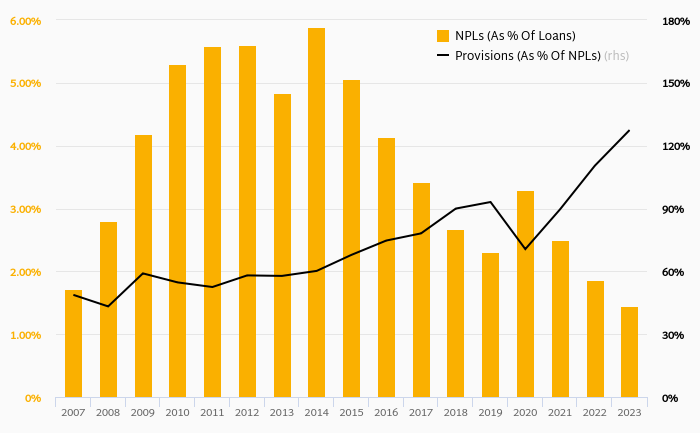
| NPLs (As % Of Loans) | % | 3.25 | 5.13 | 5.48 |
| Provisions (As % Of NPLs) | % | 114 | 116 | 119 |
| Growth Rates | 2021 | 2022 | 2023 | |
| Total Revenue Growth | % | 15.0 | 86.4 | 3.15 |
| Operating Cost Growth | % | 28.4 | 55.8 | 10.5 |
| Operating Profit Growth | % | 3.94 | 118 | -2.20 |
| Net Profit Growth | % | 41.5 | 58.3 | -13.5 |
| Customer Loan Growth | % | 14.8 | 19.2 | 17.7 |
| Total Asset Growth | % | 7.01 | 4.61 | 4.70 |
| Customer Deposit Growth | % | 4.61 | -0.240 | 5.28 |
| Shareholders' Equity Growth | % | 17.3 | -0.374 | -9.20 |
| Employees | 955 | 1,037 | 1,050 | |
Get all company financials in excel:
| summary | Unit | 2010 | 2011 | 2012 | 2013 | 2014 | 2015 | 2016 | 2017 | 2018 | 2019 | 2020 | 2021 | 2022 | 2023 |
| income statement | |||||||||||||||
| Net Interest Income | CZK mil | 2,482 | 2,773 | 3,535 | 3,691 | 3,742 | |||||||||
| Total Revenues | CZK mil | 2,938 | 2,914 | 3,687 | 3,848 | 4,426 | |||||||||
| Operating Profit | CZK mil | 1,389 | 1,298 | 1,982 | 2,105 | 2,188 | |||||||||
| Net Profit | CZK mil | 1,125 | 1,082 | 1,544 | 1,316 | 1,862 | |||||||||
| balance sheet | |||||||||||||||
| Interbank Loans | CZK mil | 384 | 2,229 | 1,978 | 2,378 | 2,691 | |||||||||
| Customer Loans | CZK mil | 38,760 | 45,860 | 55,571 | 58,777 | 67,497 | |||||||||
| Investments | CZK mil | 20,267 | 20,019 | 18,748 | 26,964 | 40,617 | |||||||||
| Total Assets | CZK mil | 99,293 | 113,029 | 119,673 | 137,369 | 146,998 | |||||||||
| Shareholders' Equity | CZK mil | 6,743 | 7,869 | 9,908 | 10,723 | 12,583 | |||||||||
| Interbank Borrowing | CZK mil | 0 | 93.9 | 53.1 | 40.4 | 0 | |||||||||
| Customer Deposits | CZK mil | 89,524 | 102,108 | 107,067 | 123,618 | 129,320 | |||||||||
| Issued Debt Securities | CZK mil | 1,360 | 1,357 | 202 | 255 | 278 | |||||||||
| ratios | |||||||||||||||
| ROE | % | ... | 18.4 | 14.8 | 17.4 | 12.8 | 16.0 | ||||||||
| ROA | % | ... | 1.20 | 1.02 | 1.33 | 1.02 | 1.31 | ||||||||
| Costs (As % Of Assets) | % | ... | 1.66 | 1.52 | 1.47 | 1.36 | 1.57 | ||||||||
| Costs (As % Of Income) | % | 52.7 | 55.5 | 46.2 | 45.3 | 50.6 | |||||||||
| Capital Adequacy Ratio | % | ... | ... | 13.5 | 16.8 | 15.4 | 15.8 | 18.2 | |||||||
| Net Interest Margin | % | ... | 2.66 | 2.61 | 3.04 | 2.87 | 2.63 | ||||||||
| Interest Income (As % Of Revenues) | % | 84.5 | 95.2 | 95.9 | 95.9 | 84.5 | |||||||||
| Fee Income (As % Of Revenues) | % | 6.43 | 7.41 | 4.15 | 4.24 | 13.3 | |||||||||
| Staff Cost (As % Of Total Cost) | % | 34.9 | 38.1 | 37.2 | 36.3 | 37.0 | |||||||||
| Equity (As % Of Assets) | % | 6.79 | 6.96 | 8.28 | 7.81 | 8.56 | |||||||||
| Loans (As % Of Deposits) | % | ... | 43.3 | 44.9 | 51.9 | 47.5 | 52.2 | ||||||||
| Loans (As % Assets) | % | 39.0 | 40.6 | 46.4 | 42.8 | 45.9 | |||||||||
| NPLs (As % Of Loans) | % | ... | ... | 2.98 | 2.29 | 1.69 | 3.19 | 3.25 | |||||||
| Provisions (As % Of NPLs) | % | ... | ... | 113 | 125 | 124 | 112 | 114 |
| income statement | Unit | 2010 | 2011 | 2012 | 2013 | 2014 | 2015 | 2016 | 2017 | 2018 | 2019 | 2020 | 2021 | 2022 | 2023 |
| income statement | |||||||||||||||
| Interest Income | CZK mil | 2,948 | 3,333 | 4,199 | 4,138 | 4,147 | |||||||||
| Interest Cost | CZK mil | 466 | 560 | 664 | 447 | 405 | |||||||||
| Net Interest Income | CZK mil | 2,482 | 2,773 | 3,535 | 3,691 | 3,742 | |||||||||
| Net Fee Income | CZK mil | 189 | 216 | 153 | 163 | 589 | |||||||||
| Fee Income | CZK mil | ... | ... | ... | ... | ... | ... | ... | ... | ... | 512 | 573 | 914 | ||
| Fee Expense | CZK mil | ... | ... | ... | ... | ... | ... | ... | ... | ... | 359 | 410 | 325 | ||
| Other Income | CZK mil | 267 | -75.0 | -1.00 | -6.00 | 95.0 | |||||||||
| Total Revenues | CZK mil | 2,938 | 2,914 | 3,687 | 3,848 | 4,426 | |||||||||
| Staff Cost | CZK mil | 540 | 616 | 634 | 633 | 828 | |||||||||
| Depreciation | CZK mil | 267 | 305 | 421 | 456 | 513 | |||||||||
| Other Cost | CZK mil | 742 | 695 | 650 | 654 | 897 | |||||||||
| Operating Cost | CZK mil | 1,549 | 1,616 | 1,705 | 1,743 | 2,238 | |||||||||
| Operating Profit | CZK mil | 1,389 | 1,298 | 1,982 | 2,105 | 2,188 | |||||||||
| Provisions | CZK mil | -100 | -144 | 54.0 | 462 | -73.0 | |||||||||
| Extra and Other Cost | CZK mil | 0 | 0 | 0 | 0 | 0 | |||||||||
| Pre-Tax Profit | CZK mil | 1,489 | 1,442 | 1,928 | 1,643 | 2,261 | |||||||||
| Tax | CZK mil | 364 | 360 | 384 | 327 | 399 | |||||||||
| Minorities | CZK mil | 0 | 0 | 0 | 0 | 0 | |||||||||
| Net Profit | CZK mil | 1,125 | 1,082 | 1,544 | 1,316 | 1,862 | |||||||||
| Net Profit Avail. to Common | CZK mil | 1,125 | 1,082 | 1,544 | 1,316 | 1,862 | |||||||||
| Dividends | CZK mil | ... | ... | ... | ... | ... | ... | ... | ... | ... | ... | 0 | 3,099 | ... | |
| growth rates | |||||||||||||||
| Net Interest Income Growth | % | ... | 19.8 | 11.7 | 27.5 | 4.41 | 1.38 | ||||||||
| Net Fee Income Growth | % | ... | -27.6 | 14.3 | -29.2 | 6.54 | 261 | ||||||||
| Total Revenue Growth | % | ... | 17.1 | -0.817 | 26.5 | 4.37 | 15.0 | ||||||||
| Operating Cost Growth | % | ... | 9.24 | 4.33 | 5.51 | 2.23 | 28.4 | ||||||||
| Operating Profit Growth | % | ... | 27.3 | -6.55 | 52.7 | 6.21 | 3.94 | ||||||||
| Pre-Tax Profit Growth | % | ... | 166 | -3.16 | 33.7 | -14.8 | 37.6 | ||||||||
| Net Profit Growth | % | ... | 148 | -3.82 | 42.7 | -14.8 | 41.5 | ||||||||
| market share | |||||||||||||||
| Market Share in Revenues | % | 1.64 | 1.53 | 1.82 | 2.13 | 2.40 | |||||||||
| Market Share in Net Profit | % | 1.49 | 1.33 | 1.69 | 2.77 | 2.65 | |||||||||
| Market Share in Employees | % | ... | 1.83 | 1.79 | 1.92 | 1.92 | 2.40 | ||||||||
| Market Share in Branches | % | ... | ... | 1.80 | 1.79 | 1.84 | 2.02 | 2.01 |
| balance sheet | Unit | 2010 | 2011 | 2012 | 2013 | 2014 | 2015 | 2016 | 2017 | 2018 | 2019 | 2020 | 2021 | 2022 | 2023 |
| balance sheet | |||||||||||||||
| Cash & Cash Equivalents | CZK mil | 36,014 | 42,141 | 39,796 | 45,556 | 31,928 | |||||||||
| Interbank Loans | CZK mil | 384 | 2,229 | 1,978 | 2,378 | 2,691 | |||||||||
| Customer Loans | CZK mil | 38,760 | 45,860 | 55,571 | 58,777 | 67,497 | |||||||||
| Retail Loans | CZK mil | 31,104 | 37,844 | 44,630 | 51,873 | 61,738 | |||||||||
| Mortgage Loans | CZK mil | 3,018 | 4,904 | 5,731 | 7,331 | 11,667 | |||||||||
| Consumer Loans | CZK mil | 28,086 | 32,940 | 38,899 | 44,542 | 50,071 | |||||||||
| Corporate Loans | CZK mil | 9,001 | 9,353 | 12,290 | 9,460 | 8,364 | |||||||||
| Investments | CZK mil | 20,267 | 20,019 | 18,748 | 26,964 | 40,617 | |||||||||
| Property and Equipment | CZK mil | 353 | 291 | 717 | 630 | 517 | |||||||||
| Intangible Assets | CZK mil | ... | ... | 1,274 | 1,321 | 1,346 | 1,585 | 1,572 | |||||||
| Total Assets | CZK mil | 99,293 | 113,029 | 119,673 | 137,369 | 146,998 | |||||||||
| Shareholders' Equity | CZK mil | 6,743 | 7,869 | 9,908 | 10,723 | 12,583 | |||||||||
| Of Which Minority Interest | CZK mil | 0 | 0 | 0 | 0 | 0 | |||||||||
| Liabilities | CZK mil | 92,550 | 105,160 | 109,765 | 126,646 | 134,415 | |||||||||
| Interbank Borrowing | CZK mil | 0 | 93.9 | 53.1 | 40.4 | 0 | |||||||||
| Customer Deposits | CZK mil | 89,524 | 102,108 | 107,067 | 123,618 | 129,320 | |||||||||
| Retail Deposits | CZK mil | 89,524 | 102,108 | 107,067 | 123,618 | 129,320 | |||||||||
| Corporate Deposits | CZK mil | 0 | 0 | 0 | 0 | 0 | |||||||||
| Sight Deposits | CZK mil | ... | ... | ... | ... | ... | ... | ... | ... | ... | 29,067 | 35,414 | 41,434 | ||
| Term Deposits | CZK mil | ... | ... | ... | ... | ... | ... | ... | ... | ... | 78,000 | 88,204 | 87,886 | ||
| Issued Debt Securities | CZK mil | 1,360 | 1,357 | 202 | 255 | 278 | |||||||||
| Subordinated Debt | CZK mil | ... | ... | ... | ... | ... | ... | ... | ... | ... | 202 | 255 | 278 | ||
| Other Liabilities | CZK mil | 1,666 | 1,601 | 2,443 | 2,732 | 4,817 | |||||||||
| asset quality | |||||||||||||||
| Non-Performing Loans | CZK mil | ... | ... | 1,199 | 1,080 | 961 | 1,958 | 2,278 | |||||||
| Gross Loans | CZK mil | ... | ... | 40,226 | 47,213 | 56,920 | 61,333 | 70,102 | |||||||
| Risk-Weighted Assets | CZK mil | ... | ... | ... | 54,783 | 47,776 | 55,459 | 59,652 | 62,966 | ||||||
| Total Provisions | CZK mil | ... | ... | 1,356 | 1,353 | 1,195 | 2,186 | 2,605 | |||||||
| growth rates | |||||||||||||||
| Customer Loan Growth | % | ... | ... | ... | 17.4 | 18.3 | 21.2 | 5.77 | 14.8 | ||||||
| Retail Loan Growth | % | ... | ... | ... | 6.82 | 21.7 | 17.9 | 16.2 | 19.0 | ||||||
| Mortgage Loan Growth | % | ... | ... | ... | ... | ... | ... | 63.8 | 62.5 | 16.9 | 27.9 | 59.1 | |||
| Consumer Loan Growth | % | ... | ... | ... | 2.97 | 17.3 | 18.1 | 14.5 | 12.4 | ||||||
| Corporate Loan Growth | % | ... | ... | ... | 56.5 | 3.91 | 31.4 | -23.0 | -11.6 | ||||||
| Total Asset Growth | % | ... | 13.6 | 13.8 | 5.88 | 14.8 | 7.01 | ||||||||
| Shareholders' Equity Growth | % | ... | 22.6 | 16.7 | 25.9 | 8.23 | 17.3 | ||||||||
| Customer Deposit Growth | % | ... | ... | 13.5 | 14.1 | 4.86 | 15.5 | 4.61 | |||||||
| Retail Deposit Growth | % | ... | ... | 13.5 | 14.1 | 4.86 | 15.5 | 4.61 | |||||||
| market share | |||||||||||||||
| Market Share in Customer Loans | % | 1.26 | 1.39 | 1.61 | 1.63 | 1.75 | ... | ||||||||
| Market Share in Corporate Loans | % | 0.881 | 0.866 | 1.10 | 0.842 | 0.704 | |||||||||
| Market Share in Retail Loans | % | 2.04 | 2.30 | 2.56 | 2.79 | 3.02 | |||||||||
| Market Share in Consumer Loans | % | 7.36 | 8.24 | 9.37 | 10.5 | 11.2 | |||||||||
| Market Share in Mortgage Loans | % | 0.263 | 0.394 | 0.431 | 0.511 | 0.731 | |||||||||
| Market Share in Total Assets | % | 1.42 | 1.55 | 1.58 | 1.72 | 1.72 | |||||||||
| Market Share in Customer Deposits | % | 2.15 | 2.30 | 2.26 | 2.39 | 2.35 | |||||||||
| Market Share in Retail Deposits | % | 3.78 | 3.99 | 3.93 | 4.04 | 3.96 | |||||||||
| Market Share in Corporate Deposits | % | 0 | 0 | 0 | 0 | 0 |
| ratios | Unit | 2010 | 2011 | 2012 | 2013 | 2014 | 2015 | 2016 | 2017 | 2018 | 2019 | 2020 | 2021 | 2022 | 2023 |
| ROE | % | ... | 18.4 | 14.8 | 17.4 | 12.8 | 16.0 | ||||||||
| ROTE | % | ... | ... | ... | 23.0 | 18.0 | 20.4 | 14.9 | 18.5 | ||||||
| ROE (@ 15% of RWA) | % | ... | ... | ... | ... | 15.4 | 14.1 | 19.9 | 15.2 | 20.2 | |||||
| ROA | % | ... | 1.20 | 1.02 | 1.33 | 1.02 | 1.31 | ||||||||
| Return on Loans | % | ... | ... | 3.13 | 2.56 | 3.04 | 2.30 | 2.95 | |||||||
| Operating Profit (As % of RWA) | % | ... | ... | ... | ... | 2.84 | 2.53 | 3.84 | 3.66 | 3.57 | |||||
| Costs (As % Of Assets) | % | ... | 1.66 | 1.52 | 1.47 | 1.36 | 1.57 | ||||||||
| Costs (As % Of Income) | % | 52.7 | 55.5 | 46.2 | 45.3 | 50.6 | |||||||||
| Costs (As % Of Loans) | % | ... | ... | 4.32 | 3.82 | 3.36 | 3.05 | 3.54 | |||||||
| Costs (As % Of Loans & Deposits) | % | ... | 1.29 | 1.17 | 1.10 | 1.01 | 1.18 | ||||||||
| Capital Adequacy Ratio | % | ... | ... | 13.5 | 16.8 | 15.4 | 15.8 | 18.2 | |||||||
| Tier 1 Ratio | % | ... | ... | ... | 10.5 | 14.0 | 15.0 | 15.4 | 17.7 | ||||||
| Net Interest Margin | % | ... | 2.66 | 2.61 | 3.04 | 2.87 | 2.63 | ||||||||
| Interest Spread | % | ... | 2.62 | 2.57 | 2.99 | 2.84 | 2.61 | ||||||||
| Asset Yield | % | ... | 3.16 | 3.14 | 3.61 | 3.22 | 2.92 | ||||||||
| Revenues (As % of RWA) | % | ... | ... | ... | ... | 6.02 | 5.68 | 7.14 | 6.69 | 7.22 | |||||
| Cost Of Liabilities | % | ... | 0.534 | 0.566 | 0.618 | 0.378 | 0.310 | ||||||||
| Payout Ratio | % | ... | ... | ... | ... | ... | ... | ... | ... | ... | ... | 0 | 166 | ... | |
| Interest Income (As % Of Revenues) | % | 84.5 | 95.2 | 95.9 | 95.9 | 84.5 | |||||||||
| Fee Income (As % Of Revenues) | % | 6.43 | 7.41 | 4.15 | 4.24 | 13.3 | |||||||||
| Other Income (As % Of Revenues) | % | 9.09 | -2.57 | -0.027 | -0.156 | 2.15 | |||||||||
| Staff Cost (As % Of Total Cost) | % | 34.9 | 38.1 | 37.2 | 36.3 | 37.0 | |||||||||
| Equity (As % Of Assets) | % | 6.79 | 6.96 | 8.28 | 7.81 | 8.56 | |||||||||
| Equity (As % Of Loans) | % | ... | ... | 17.4 | 17.2 | 17.8 | 18.2 | 18.6 | |||||||
| Loans (As % Of Deposits) | % | ... | 43.3 | 44.9 | 51.9 | 47.5 | 52.2 | ||||||||
| Loans (As % Assets) | % | 39.0 | 40.6 | 46.4 | 42.8 | 45.9 | |||||||||
| NPLs (As % Of Loans) | % | ... | ... | 2.98 | 2.29 | 1.69 | 3.19 | 3.25 | |||||||
| Provisions (As % Of NPLs) | % | ... | ... | 113 | 125 | 124 | 112 | 114 | |||||||
| Provisions (As % Of Loans) | % | ... | ... | 3.50 | 2.95 | 2.15 | 3.72 | 3.86 | |||||||
| Cost of Provisions (As % Of Loans) | % | ... | ... | -0.279 | -0.340 | 0.106 | 0.808 | -0.116 |
| other data | Unit | 2010 | 2011 | 2012 | 2013 | 2014 | 2015 | 2016 | 2017 | 2018 | 2019 | 2020 | 2021 | 2022 | 2023 |
| Branches | ... | ... | 35.0 | 35.0 | 35.0 | 34.0 | 32.0 | ||||||||
| ATMs | ... | ... | 321 | 365 | 373 | 373 | 369 | ||||||||
| ATMs (As % of Bank Branches) | % | ... | ... | 917 | 1,043 | 1,066 | 1,097 | 1,153 | |||||||
| Employees | ... | 767 | 750 | 798 | 782 | 955 | |||||||||
| Employees Per Bank Branch | ... | ... | 21.9 | 21.4 | 22.8 | 23.0 | 29.8 | ||||||||
| Cost Per Employee | USD per month | ... | 2,500 | 3,128 | 2,937 | 3,066 | 3,334 | ||||||||
| Cost Per Employee (Local Currency) | CZK per month | ... | 58,670 | 68,444 | 66,207 | 67,455 | 72,251 |
| customer breakdown | Unit | 2010 | 2011 | 2012 | 2013 | 2014 | 2015 | 2016 | 2017 | 2018 | 2019 | 2020 | 2021 | 2022 | 2023 |
| Customers | mil | 0.597 | 0.673 | 0.788 | 0.862 | 0.986 | |||||||||
| Number of Primary Customers | mil | ... | ... | ... | ... | ... | ... | ... | 0.625 | 0.722 | 0.860 | 0.940 | 1.04 | ||
| Number of Mortgages | mil | ... | ... | ... | ... | ... | ... | ... | 0.003 | 0.004 | 0.004 | 0.005 | 0.008 | ||
| Number of Consumer Loans | mil | ... | ... | ... | ... | ... | ... | ... | 0.124 | 0.130 | 0.143 | 0.146 | 0.164 | ||
| Average Size of Mortgage Loan | CZK | ... | ... | ... | ... | ... | ... | ... | 1,152,834 | 1,280,363 | 1,322,030 | 1,426,542 | 1,531,473 | ||
| Average Size of Consumer Loan | CZK | ... | ... | ... | ... | ... | ... | ... | 226,491 | 253,040 | 271,455 | 305,185 | 305,142 | ||
| Primary (As % of Total Clients) | % | ... | ... | ... | ... | ... | ... | ... | 105 | 107 | 109 | 109 | 106 | ||
| Mortgages (As % of Total Clients) | % | ... | ... | ... | ... | ... | ... | ... | 0.439 | 0.569 | 0.550 | 0.596 | 0.773 | ||
| Consumer Loans (As % of Total Clients) | % | ... | ... | ... | ... | ... | ... | ... | 20.8 | 19.3 | 18.2 | 16.9 | 16.6 | ||
| Revenue per Customer (Local Currency) | CZK | ... | 4,921 | 4,330 | 4,679 | 4,464 | 4,489 | ||||||||
| Net Profit per Customer (Local Currency) | CZK | ... | 1,884 | 1,608 | 1,959 | 1,527 | 1,888 | ||||||||
| Loan per Customer (Local Currency) | CZK | ... | 64,925 | 68,143 | 70,522 | 68,187 | 68,455 | ||||||||
| Deposit per Customer (Local Currency) | CZK | ... | 149,956 | 151,721 | 135,872 | 143,409 | 131,156 | ||||||||
| Revenue per Customer | USD | ... | 210 | 198 | 208 | 203 | 207 | ||||||||
| Net Profit per Customer | USD | ... | 80.3 | 73.5 | 86.9 | 69.4 | 87.1 | ||||||||
| Loan per Customer | USD | ... | 3,049 | 3,033 | 3,118 | 3,188 | 3,119 | ||||||||
| Deposit per Customer | USD | ... | 7,043 | 6,753 | 6,006 | 6,705 | 5,975 |
Get all company financials in excel:


By Helgi Library - May 7, 2024
Air Bank's mortgage loans reached CZK 17,997 mil in 4Q2023, up 4.33% compared to the previous year. Czech banking sector provided mortgage loans of CZK 1,742 bil in 4Q2023, up 0.752% when compared to the last year. Air Bank accounted for 1.03% of all mort...
By Helgi Library - May 7, 2024
Air Bank's retail loans reached CZK 96,949 mil in the fourth quarter of 2023, up 4.87% compared to the previous year. Czech banking sector provided retail loans of CZK 2,242 bil in 4Q2023, up 0.906% when compared to the last year. Air Bank accounted for 4...
By Helgi Library - May 7, 2024
Air Bank employed 1,013 persons in 2023-12-31, up 1.84% when compared to the previous year. Historically, the bank's workforce hit an all time high of 1,013 persons in 2023-12-31 and an all time low of 414 in 2012-12-31. Average cost reached USD 4,236 per month p...
By Helgi Library - May 7, 2024
Air Bank's customer deposits reached CZK 135,824 mil in 2023-12-31, up 2.77% compared to the previous year. Czech banking sector accepted customer deposits of CZK 6,701 bil in 2023-12-31, down 3.35% when compared to the last year. Air Bank accounted for 2...
By Helgi Library - May 7, 2024
Air Bank generated total banking revenues of CZK 1,508 mil in 2023-12-31, down 0.761% compared to the previous year. Czech banking sector banking sector generated total revenues of CZK 58,954 mil in 2023-12-31, up 3.14% when compared to the last year....
By Helgi Library - May 7, 2024
Air Bank's loans reached in the first quarter of 1970, down from when compared to the previous quarter and down from when compared to the same period of last year. Historically, the bank’s loans reached an all time high of CZK mil in 1Q1970 ...
By Helgi Library - May 7, 2024
Air Bank's retail deposits reached CZK 135,824 mil in 2023-12-31, up 2.77% compared to the previous year. Czech banking sector accepted retail deposits of CZK 3,651 bil in 2023-12-31, up 2.05% when compared to the last year. Air Bank accounted for 3.72% o...
By Helgi Library - May 7, 2024
Air Bank's non-performing loans reached 1.31% of total loans at the end of 2023-12-31, up from 1.14% compared to the previous year. Historically, the NPL ratio hit an all time high of 1.89% in 2018-12-31 and an all time low of 0.004% in 2013-03-31. Provisio...
By Helgi Library - May 7, 2024
Air Bank's consumer loans reached CZK 78,952 mil in 2023-12-31, up 4.99% compared to the previous year. Czech banking sector provided consumer loans of CZK 500 bil in 2023-12-31, up 1.45% when compared to the last year. Air Bank accounted for 15.8% of all...
By Helgi Library - May 7, 2024
Air Bank's net interest margin amounted to 2.97% in the fourth quarter of 2023, down from 3.05% when compared to the previous quarter. Historically, the bank’s net interest margin reached an all time high of 3.68% in 1Q2020 and an all time low of -0.856...
Air Bank is a Czech Republic-based commercial bank set up and owned by the PPF Group. The Bank officially started its operations in the Czech Republic in November 2011 with a special focus on the online banking and friendly customer care. The Bank's product portfolio remains fairly limited with a special focus on the current and savings accounts and consumer loans.. But, the Bank develops fast and tries to differentiate from the market by its friendly approach such as operating through branches without counters, open in the evenings and during the weekends. At the end of 2018, Air Bank had almost 800 employees, it was operating 35 branches in major Czech cities, and had more than 660,000 customers

Air Bank has been growing its revenues and asset by 30.3% and 5.43% a year on average in the last 3 years. Its loans and deposits have grown by 17.2% and 3.19% a year during that time and loans to deposits ratio reached 69.7% at the end of 2023. The company achieved an average return on equity of 20.3% in the last three years with net profit growing 24.7% a year on average. In terms of operating efficiency, its cost to income ratio reached 45.3% in 2023, compared to 46.0% average in the last three years.
Equity represented 7.07% of total assets or of loans at the end of 2023. Air Bank's non-performing loans were 5.48% of total loans while provisions covered some 119% of NPLs at the end of 2023.
 Helgi Library