By Helgi Library - May 8, 2024
Max banka's customer deposits reached CZK 60,158 mil in 2023-12-31, up 12.3% compared to the previous year. Czech banking secto...
By Helgi Library - May 8, 2024
Max banka's capital adequacy ratio reached 51.1% at the end of fourth quarter of 2023, up from 45.8% when compared to the previou...
By Helgi Library - May 8, 2024
Max banka's retail deposits reached CZK 59,331 mil in 2023-12-31, up 12.8% compared to the previous year. Czech banking sector ...
| Profit Statement | 2021 | 2022 | 2023 | |
| Net Interest Income | CZK mil | 357 | 471 | 753 |
| Net Fee Income | CZK mil | 21.0 | 6.00 | 0 |
| Other Income | CZK mil | 62.0 | -164 | 29.0 |
| Total Revenues | CZK mil | 440 | 313 | 782 |
| Staff Cost | CZK mil | 282 | 303 | 218 |
| Operating Profit | CZK mil | -65.0 | -239 | 292 |
| Provisions | CZK mil | -1.00 | 0 | 0 |
| Net Profit | CZK mil | -58.0 | -233 | 304 |
| Balance Sheet | 2021 | 2022 | 2023 | |
| Interbank Loans | CZK mil | 7,677 | 25,548 | 57,286 |
| Customer Loans | CZK mil | 6,304 | 5,001 | 3,168 |
| Investments | CZK mil | 1,607 | 1,360 | 1,112 |
| Total Assets | CZK mil | 16,384 | 33,077 | 63,901 |
| Shareholders' Equity | CZK mil | 2,288 | 1,991 | 3,521 |
| Interbank Borrowing | CZK mil | 2,865 | 2,407 | 8.00 |
| Customer Deposits | CZK mil | 10,613 | 28,081 | 60,158 |
| Issued Debt Securities | CZK mil | 0 | 0 | 0 |
| Ratios | 2021 | 2022 | 2023 | |
| ROE | % | -2.32 | -10.9 | 11.0 |
| ROA | % | -0.357 | -0.942 | 0.627 |
| Costs (As % Of Assets) | % | 3.11 | 2.23 | 1.01 |
| Costs (As % Of Income) | % | 115 | 176 | 62.7 |
| Capital Adequacy Ratio | % | 26.2 | 28.3 | 51.1 |
| Net Interest Margin | % | 2.20 | 1.90 | 1.55 |
| Loans (As % Of Deposits) | % | 59.4 | 17.8 | 5.27 |
| NPLs (As % Of Loans) | % | 0.492 | 0.801 | 1.26 |
| Provisions (As % Of NPLs) | % | 416 | 280 | 180 |
| Growth Rates | 2021 | 2022 | 2023 | |
| Total Revenue Growth | % | 22.2 | -28.9 | 150 |
| Operating Cost Growth | % | -4.54 | 9.31 | -11.2 |
| Operating Profit Growth | % | -61.5 | 268 | -222 |
| Net Profit Growth | % | -73.8 | 302 | -230 |
| Customer Loan Growth | % | -13.3 | -20.7 | -36.7 |
| Total Asset Growth | % | 1.78 | 102 | 93.2 |
| Customer Deposit Growth | % | -2.29 | 165 | 114 |
| Shareholders' Equity Growth | % | -15.5 | -13.0 | 76.8 |
| Employees | 201 | 196 | 140 | |
Get all company financials in excel:
| summary | Unit | 2004 | 2005 | 2006 | 2007 | 2008 | 2009 | 2010 | 2011 | 2012 | 2013 | 2014 | 2015 | 2016 | 2017 | 2018 | 2019 | 2020 | 2021 | 2022 | 2023 |
| income statement | |||||||||||||||||||||
| Net Interest Income | CZK mil | 335 | 432 | 497 | 371 | 357 | |||||||||||||||
| Total Revenues | CZK mil | 554 | 712 | 718 | 360 | 440 | |||||||||||||||
| Operating Profit | CZK mil | 77.0 | 205 | 152 | -169 | -65.0 | |||||||||||||||
| Net Profit | CZK mil | -71.0 | 201 | 127 | -221 | -58.0 | |||||||||||||||
| balance sheet | |||||||||||||||||||||
| Interbank Loans | CZK mil | 14,009 | 14,542 | 11,366 | 5,673 | 7,677 | |||||||||||||||
| Customer Loans | CZK mil | 9,111 | 8,027 | 7,688 | 7,274 | 6,304 | |||||||||||||||
| Investments | CZK mil | 1,274 | 1,615 | 1,087 | 1,494 | 1,607 | |||||||||||||||
| Total Assets | CZK mil | 25,235 | 24,913 | 20,980 | 16,097 | 16,384 | |||||||||||||||
| Shareholders' Equity | CZK mil | 3,068 | 2,806 | 2,935 | 2,707 | 2,288 | |||||||||||||||
| Interbank Borrowing | CZK mil | 5,181 | 6,703 | 4,351 | 2,397 | 2,865 | |||||||||||||||
| Customer Deposits | CZK mil | 16,208 | 14,951 | 13,533 | 10,862 | 10,613 | |||||||||||||||
| Issued Debt Securities | CZK mil | 434 | 234 | 0 | 0 | 0 | |||||||||||||||
| ratios | |||||||||||||||||||||
| ROE | % | ... | -2.29 | 6.84 | 4.42 | -7.83 | -2.32 | ||||||||||||||
| ROA | % | ... | -0.295 | 0.802 | 0.553 | -1.19 | -0.357 | ||||||||||||||
| Costs (As % Of Assets) | % | ... | 1.98 | 2.02 | 2.47 | 2.85 | 3.11 | ||||||||||||||
| Costs (As % Of Income) | % | 86.1 | 71.2 | 78.8 | 147 | 115 | |||||||||||||||
| Capital Adequacy Ratio | % | 28.2 | 23.9 | 27.5 | 27.6 | 26.2 | |||||||||||||||
| Net Interest Margin | % | ... | 1.39 | 1.72 | 2.17 | 2.00 | 2.20 | ||||||||||||||
| Interest Income (As % Of Revenues) | % | 60.5 | 60.7 | 69.2 | 103 | 81.1 | |||||||||||||||
| Fee Income (As % Of Revenues) | % | 11.0 | 7.30 | 6.13 | 8.06 | 4.77 | |||||||||||||||
| Staff Cost (As % Of Total Cost) | % | 53.7 | 50.9 | 53.2 | 58.6 | 55.8 | |||||||||||||||
| Equity (As % Of Assets) | % | 12.2 | 11.3 | 14.0 | 16.8 | 14.0 | |||||||||||||||
| Loans (As % Of Deposits) | % | 56.2 | 53.7 | 56.8 | 67.0 | 59.4 | |||||||||||||||
| Loans (As % Assets) | % | 36.1 | 32.2 | 36.6 | 45.2 | 38.5 | |||||||||||||||
| NPLs (As % Of Loans) | % | 4.48 | 5.96 | 0.702 | 0.669 | 0.492 | |||||||||||||||
| Provisions (As % Of NPLs) | % | 56.8 | 56.2 | 276 | 408 | 416 | |||||||||||||||
| valuation | |||||||||||||||||||||
| Book Value Per Share Growth | % | ... | -4.56 | 29.0 | 15.0 | -25.4 | -3.77 |
| income statement | Unit | 2004 | 2005 | 2006 | 2007 | 2008 | 2009 | 2010 | 2011 | 2012 | 2013 | 2014 | 2015 | 2016 | 2017 | 2018 | 2019 | 2020 | 2021 | 2022 | 2023 |
| income statement | |||||||||||||||||||||
| Interest Income | CZK mil | 446 | 520 | 595 | 457 | 405 | |||||||||||||||
| Interest Cost | CZK mil | 111 | 88.0 | 98.0 | 86.0 | 48.0 | |||||||||||||||
| Net Interest Income | CZK mil | 335 | 432 | 497 | 371 | 357 | |||||||||||||||
| Net Fee Income | CZK mil | 61.0 | 52.0 | 44.0 | 29.0 | 21.0 | |||||||||||||||
| Fee Income | CZK mil | ... | ... | ... | ... | ... | ... | ... | ... | ... | ... | ... | ... | ... | ... | ... | 59.0 | 42.0 | 29.0 | ||
| Fee Expense | CZK mil | ... | ... | ... | ... | ... | ... | ... | ... | ... | ... | ... | ... | ... | ... | ... | 15.0 | 13.0 | 8.00 | ||
| Other Income | CZK mil | 158 | 228 | 177 | -40.0 | 62.0 | |||||||||||||||
| Insurance Premium Earned | CZK mil | ... | ... | ... | ... | ... | ... | ... | ... | ... | ... | ... | ... | ... | ... | ... | ... | ... | 0 | ... | ... |
| Total Revenues | CZK mil | 554 | 712 | 718 | 360 | 440 | |||||||||||||||
| Staff Cost | CZK mil | 256 | 258 | 301 | 310 | 282 | |||||||||||||||
| Depreciation | CZK mil | 29.0 | 20.0 | 62.0 | 57.0 | 63.0 | |||||||||||||||
| Other Cost | CZK mil | 192 | 229 | 203 | 162 | 160 | |||||||||||||||
| Operating Cost | CZK mil | 477 | 507 | 566 | 529 | 505 | |||||||||||||||
| Operating Profit | CZK mil | 77.0 | 205 | 152 | -169 | -65.0 | |||||||||||||||
| Provisions | CZK mil | 142 | -10.0 | 17.0 | 51.0 | -1.00 | |||||||||||||||
| Extra and Other Cost | CZK mil | 0 | 0 | 0 | 0 | 0 | |||||||||||||||
| Pre-Tax Profit | CZK mil | -65.0 | 215 | 135 | -220 | -64.0 | |||||||||||||||
| Tax | CZK mil | 6.00 | 14.0 | 18.0 | -1.00 | -6.00 | |||||||||||||||
| Minorities | CZK mil | 0 | 0 | 0 | 0 | 0 | |||||||||||||||
| Net Profit | CZK mil | -71.0 | 201 | 127 | -221 | -58.0 | |||||||||||||||
| Net Profit Avail. to Common | CZK mil | -71.0 | 201 | 127 | -221 | -58.4 | |||||||||||||||
| Dividends | CZK mil | ... | ... | ... | ... | ... | ... | ... | ... | ... | ... | ... | ... | ... | ... | ... | ... | 0 | 0 | ||
| growth rates | |||||||||||||||||||||
| Net Interest Income Growth | % | ... | -4.56 | 29.0 | 15.0 | -25.4 | -3.77 | ||||||||||||||
| Net Fee Income Growth | % | ... | -19.7 | -14.8 | -15.4 | -34.1 | -27.6 | ||||||||||||||
| Total Revenue Growth | % | ... | -51.4 | 28.5 | 0.843 | -49.9 | 22.2 | ||||||||||||||
| Operating Cost Growth | % | ... | 18.6 | 6.29 | 11.6 | -6.54 | -4.54 | ||||||||||||||
| Operating Profit Growth | % | ... | -89.6 | 166 | -25.9 | -211 | -61.5 | ||||||||||||||
| Pre-Tax Profit Growth | % | ... | -115 | -431 | -37.2 | -263 | -70.9 | ||||||||||||||
| Net Profit Growth | % | ... | -122 | -383 | -36.8 | -274 | -73.8 | ||||||||||||||
| market share | |||||||||||||||||||||
| Market Share in Revenues | % | 0.309 | 0.374 | 0.355 | 0.200 | 0.239 | |||||||||||||||
| Market Share in Net Profit | % | -0.094 | 0.247 | 0.139 | -0.466 | -0.082 | |||||||||||||||
| Market Share in Employees | % | 0.513 | 0.490 | 0.502 | 0.491 | 0.506 | |||||||||||||||
| Market Share in Branches | % | ... | ... | ... | ... | 0.360 | 0.102 | 0.053 | 0.059 | 0.063 |
| balance sheet | Unit | 2004 | 2005 | 2006 | 2007 | 2008 | 2009 | 2010 | 2011 | 2012 | 2013 | 2014 | 2015 | 2016 | 2017 | 2018 | 2019 | 2020 | 2021 | 2022 | 2023 |
| balance sheet | |||||||||||||||||||||
| Cash & Cash Equivalents | CZK mil | 593 | 477 | 555 | 1,337 | 413 | |||||||||||||||
| Interbank Loans | CZK mil | 14,009 | 14,542 | 11,366 | 5,673 | 7,677 | |||||||||||||||
| Customer Loans | CZK mil | 9,111 | 8,027 | 7,688 | 7,274 | 6,304 | |||||||||||||||
| Retail Loans | CZK mil | ... | ... | ... | 4,040 | 2,265 | 1,743 | 1,350 | 1,103 | ||||||||||||
| Mortgage Loans | CZK mil | ... | ... | ... | 3,733 | 2,015 | 1,482 | 1,148 | 938 | ||||||||||||
| Consumer Loans | CZK mil | ... | ... | ... | 307 | 250 | 261 | 203 | 165 | ||||||||||||
| Corporate Loans | CZK mil | ... | ... | ... | 5,071 | 5,762 | 6,097 | 6,128 | 5,330 | ||||||||||||
| Investments | CZK mil | 1,274 | 1,615 | 1,087 | 1,494 | 1,607 | |||||||||||||||
| Property and Equipment | CZK mil | 40.0 | 60.0 | 224 | 214 | 181 | |||||||||||||||
| Intangible Assets | CZK mil | ... | ... | ... | ... | ... | ... | ... | ... | ... | ... | ... | ... | ... | ... | ... | 42.0 | 63.0 | 96.0 | ||
| Total Assets | CZK mil | 25,235 | 24,913 | 20,980 | 16,097 | 16,384 | |||||||||||||||
| Shareholders' Equity | CZK mil | 3,068 | 2,806 | 2,935 | 2,707 | 2,288 | |||||||||||||||
| Of Which Minority Interest | CZK mil | 0 | 0 | 0 | 0 | 0 | |||||||||||||||
| Liabilities | CZK mil | 22,167 | 22,107 | 18,045 | 13,390 | 14,096 | |||||||||||||||
| Interbank Borrowing | CZK mil | 5,181 | 6,703 | 4,351 | 2,397 | 2,865 | |||||||||||||||
| Customer Deposits | CZK mil | 16,208 | 14,951 | 13,533 | 10,862 | 10,613 | |||||||||||||||
| Retail Deposits | CZK mil | ... | ... | ... | 13,026 | 10,610 | 9,495 | 7,450 | 7,900 | ||||||||||||
| Corporate Deposits | CZK mil | ... | ... | ... | 2,887 | 4,056 | 3,646 | 3,090 | 2,330 | ||||||||||||
| Sight Deposits | CZK mil | ... | ... | ... | ... | ... | ... | ... | ... | ... | 13,190 | 12,222 | 11,161 | 9,753 | 9,913 | ||||||
| Term Deposits | CZK mil | ... | ... | ... | ... | ... | ... | ... | ... | ... | 3,018 | 2,729 | 2,372 | 1,109 | 700 | ||||||
| Issued Debt Securities | CZK mil | 434 | 234 | 0 | 0 | 0 | |||||||||||||||
| Subordinated Debt | CZK mil | ... | ... | ... | ... | ... | ... | ... | ... | ... | ... | ... | ... | ... | ... | ... | ... | ... | 0 | ||
| Other Liabilities | CZK mil | 344 | 219 | 161 | 131 | 618 | |||||||||||||||
| asset quality | |||||||||||||||||||||
| Non-Performing Loans | CZK mil | 419 | 495 | 55.0 | 50.0 | 31.0 | |||||||||||||||
| Gross Loans | CZK mil | 9,349 | 8,305 | 7,840 | 7,478 | 6,304 | |||||||||||||||
| Risk-Weighted Assets | CZK mil | 9,805 | 10,571 | 10,047 | 9,568 | 8,348 | |||||||||||||||
| Total Provisions | CZK mil | 238 | 278 | 152 | 204 | 129 | |||||||||||||||
| growth rates | |||||||||||||||||||||
| Customer Loan Growth | % | ... | -24.9 | -11.9 | -4.22 | -5.39 | -13.3 | ||||||||||||||
| Retail Loan Growth | % | ... | ... | ... | ... | -34.1 | -43.9 | -23.0 | -22.5 | -18.3 | |||||||||||
| Mortgage Loan Growth | % | ... | ... | ... | ... | -42.3 | -46.0 | -26.5 | -22.5 | -18.3 | |||||||||||
| Consumer Loan Growth | % | ... | ... | ... | ... | -31.0 | -18.6 | 4.58 | -22.5 | -18.3 | |||||||||||
| Corporate Loan Growth | % | ... | ... | ... | ... | 0.212 | 13.6 | 5.81 | 0.508 | -13.0 | |||||||||||
| Total Asset Growth | % | ... | 10.6 | -1.28 | -15.8 | -23.3 | 1.78 | ||||||||||||||
| Shareholders' Equity Growth | % | ... | -1.83 | -8.54 | 4.60 | -7.77 | -15.5 | ||||||||||||||
| Customer Deposit Growth | % | ... | -10.8 | -7.76 | -9.48 | -19.7 | -2.29 | ||||||||||||||
| Retail Deposit Growth | % | ... | ... | ... | ... | -11.7 | -18.5 | -10.5 | -21.5 | 6.04 | |||||||||||
| Corporate Deposit Growth | % | ... | ... | ... | ... | -3.38 | 40.5 | -10.1 | -15.2 | -24.6 | |||||||||||
| market share | |||||||||||||||||||||
| Market Share in Customer Loans | % | 0.295 | 0.243 | 0.223 | 0.202 | 0.164 | ... | ||||||||||||||
| Market Share in Corporate Loans | % | ... | ... | ... | 0.496 | 0.533 | 0.544 | 0.546 | 0.449 | ||||||||||||
| Market Share in Retail Loans | % | ... | ... | ... | 0.265 | 0.138 | 0.100 | 0.073 | 0.054 | ||||||||||||
| Market Share in Consumer Loans | % | ... | ... | ... | 0.080 | 0.063 | 0.063 | 0.048 | 0.037 | ||||||||||||
| Market Share in Mortgage Loans | % | ... | ... | ... | 0.325 | 0.162 | 0.111 | 0.080 | 0.059 | ||||||||||||
| Market Share in Total Assets | % | 0.360 | 0.342 | 0.277 | 0.202 | 0.192 | |||||||||||||||
| Market Share in Customer Deposits | % | 0.389 | 0.336 | 0.286 | 0.210 | 0.193 | |||||||||||||||
| Market Share in Retail Deposits | % | ... | ... | ... | 0.550 | 0.415 | 0.348 | 0.244 | 0.242 | ||||||||||||
| Market Share in Corporate Deposits | % | ... | ... | ... | 0.290 | 0.390 | 0.333 | 0.254 | 0.178 |
| ratios | Unit | 2004 | 2005 | 2006 | 2007 | 2008 | 2009 | 2010 | 2011 | 2012 | 2013 | 2014 | 2015 | 2016 | 2017 | 2018 | 2019 | 2020 | 2021 | 2022 | 2023 |
| ROE | % | ... | -2.29 | 6.84 | 4.42 | -7.83 | -2.32 | ||||||||||||||
| ROTE | % | ... | ... | ... | ... | ... | ... | ... | ... | ... | ... | ... | ... | ... | ... | ... | ... | -7.98 | -2.40 | ||
| ROE (@ 15% of RWA) | % | ... | -4.81 | 13.2 | 8.21 | -15.0 | -4.32 | ||||||||||||||
| ROA | % | ... | -0.295 | 0.802 | 0.553 | -1.19 | -0.357 | ||||||||||||||
| Return on Loans | % | -0.668 | 2.35 | 1.62 | -2.95 | -0.854 | |||||||||||||||
| Operating Profit (As % of RWA) | % | ... | 0.783 | 2.01 | 1.47 | -1.72 | -0.726 | ||||||||||||||
| Costs (As % Of Assets) | % | ... | 1.98 | 2.02 | 2.47 | 2.85 | 3.11 | ||||||||||||||
| Costs (As % Of Income) | % | 86.1 | 71.2 | 78.8 | 147 | 115 | |||||||||||||||
| Costs (As % Of Loans) | % | ... | 4.49 | 5.92 | 7.20 | 7.07 | 7.44 | ||||||||||||||
| Costs (As % Of Loans & Deposits) | % | ... | 1.72 | 2.10 | 2.56 | 2.69 | 2.88 | ||||||||||||||
| Capital Adequacy Ratio | % | 28.2 | 23.9 | 27.5 | 27.6 | 26.2 | |||||||||||||||
| Tier 1 Ratio | % | 28.2 | 23.9 | 27.5 | 27.6 | 26.2 | |||||||||||||||
| Net Interest Margin | % | ... | 1.39 | 1.72 | 2.17 | 2.00 | 2.20 | ||||||||||||||
| Interest Spread | % | ... | 1.33 | 1.68 | 2.10 | 1.92 | 2.14 | ||||||||||||||
| Asset Yield | % | ... | 1.86 | 2.07 | 2.59 | 2.47 | 2.49 | ||||||||||||||
| Revenues (As % of RWA) | % | ... | 5.63 | 6.99 | 6.96 | 3.67 | 4.91 | ||||||||||||||
| Cost Of Liabilities | % | ... | 0.530 | 0.398 | 0.488 | 0.547 | 0.349 | ||||||||||||||
| Payout Ratio | % | ... | ... | ... | ... | ... | ... | ... | ... | ... | ... | ... | ... | ... | ... | ... | ... | 0 | 0 | ||
| Interest Income (As % Of Revenues) | % | 60.5 | 60.7 | 69.2 | 103 | 81.1 | |||||||||||||||
| Fee Income (As % Of Revenues) | % | 11.0 | 7.30 | 6.13 | 8.06 | 4.77 | |||||||||||||||
| Other Income (As % Of Revenues) | % | 28.5 | 32.0 | 24.7 | -11.1 | 14.1 | |||||||||||||||
| Staff Cost (As % Of Total Cost) | % | 53.7 | 50.9 | 53.2 | 58.6 | 55.8 | |||||||||||||||
| Equity (As % Of Assets) | % | 12.2 | 11.3 | 14.0 | 16.8 | 14.0 | |||||||||||||||
| Equity (As % Of Loans) | % | 33.7 | 35.0 | 38.2 | 37.2 | 36.3 | |||||||||||||||
| Loans (As % Of Deposits) | % | 56.2 | 53.7 | 56.8 | 67.0 | 59.4 | |||||||||||||||
| Loans (As % Assets) | % | 36.1 | 32.2 | 36.6 | 45.2 | 38.5 | |||||||||||||||
| NPLs (As % Of Loans) | % | 4.48 | 5.96 | 0.702 | 0.669 | 0.492 | |||||||||||||||
| Provisions (As % Of NPLs) | % | 56.8 | 56.2 | 276 | 408 | 416 | |||||||||||||||
| Provisions (As % Of Loans) | % | 2.61 | 3.46 | 1.98 | 2.80 | 2.05 | |||||||||||||||
| Cost of Provisions (As % Of Loans) | % | ... | 1.34 | -0.117 | 0.216 | 0.682 | -0.015 |
| other data | Unit | 2004 | 2005 | 2006 | 2007 | 2008 | 2009 | 2010 | 2011 | 2012 | 2013 | 2014 | 2015 | 2016 | 2017 | 2018 | 2019 | 2020 | 2021 | 2022 | 2023 |
| Branches | ... | ... | ... | ... | 7.00 | 2.00 | 1.00 | 1.00 | 1.00 | ||||||||||||
| Employees | 215 | 205 | 209 | 200 | 201 | ||||||||||||||||
| Employees Per Bank Branch | ... | ... | ... | ... | 30.7 | 103 | 209 | 200 | 201 | ||||||||||||
| Cost Per Employee | USD per month | 4,229 | 4,794 | 5,324 | 5,870 | 5,396 | |||||||||||||||
| Cost Per Employee (Local Currency) | CZK per month | 99,225 | 104,878 | 120,016 | 129,167 | 116,915 | |||||||||||||||
| Insurance Fee Income (As % of Loans) | % | ... | ... | ... | ... | ... | ... | ... | ... | ... | ... | ... | ... | ... | ... | ... | ... | ... | 0 | ... | ... |
| customer breakdown | Unit | 2004 | 2005 | 2006 | 2007 | 2008 | 2009 | 2010 | 2011 | 2012 | 2013 | 2014 | 2015 | 2016 | 2017 | 2018 | 2019 | 2020 | 2021 | 2022 | 2023 |
| Customers | mil | 0.026 | 0.025 | 0.024 | 0.023 | 0.020 | |||||||||||||||
| Revenue per Customer (Local Currency) | CZK | 21,308 | 28,480 | 29,917 | 15,652 | 22,000 | |||||||||||||||
| Net Profit per Customer (Local Currency) | CZK | -2,731 | 8,040 | 5,292 | -9,609 | -2,900 | |||||||||||||||
| Loan per Customer (Local Currency) | CZK | 350,423 | 321,080 | 320,333 | 316,261 | 315,200 | |||||||||||||||
| Deposit per Customer (Local Currency) | CZK | 623,385 | 598,040 | 563,875 | 472,261 | 530,650 | |||||||||||||||
| Revenue per Customer | USD | 908 | 1,302 | 1,327 | 711 | 1,015 | |||||||||||||||
| Net Profit per Customer | USD | -116 | 367 | 235 | -437 | -134 | |||||||||||||||
| Loan per Customer | USD | 16,459 | 14,292 | 14,161 | 14,788 | 14,359 | |||||||||||||||
| Deposit per Customer | USD | 29,279 | 26,620 | 24,927 | 22,082 | 24,174 |
Get all company financials in excel:


By Helgi Library - May 8, 2024
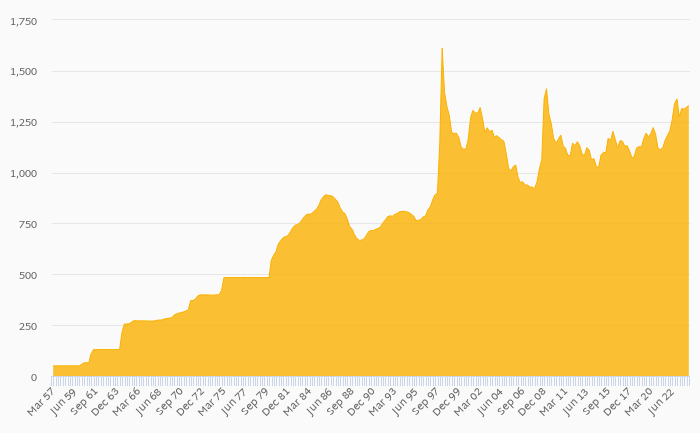
Max banka's mortgage loans reached CZK 580 mil in 4Q2023, down 6.61% compared to the previous year. Czech banking sector provided mortgage loans of CZK 1,742 bil in 4Q2023, up 0.752% when compared to the last year. Max banka accounted for 0.033% of all mo...
By Helgi Library - May 8, 2024
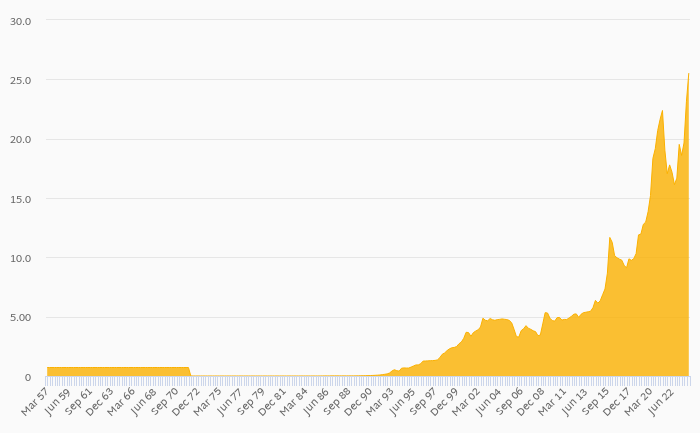
Max banka's non-performing loans reached 1.26% of total loans at the end of 2023-12-31, up from 0.801% compared to the previous year. Historically, the NPL ratio hit an all time high of 14.2% in 2011-03-31 and an all time low of 0.261% in 2023-09-30. Provis...
By Helgi Library - May 8, 2024
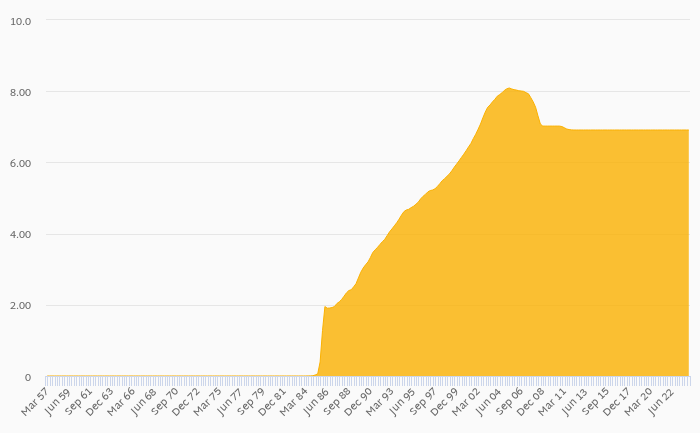
Max banka generated total banking revenues of CZK 267 mil in 2023-12-31, up 56.4% compared to the previous year. Czech banking sector banking sector generated total revenues of CZK 58,954 mil in 2023-12-31, up 3.14% when compared to the last year. ...
By Helgi Library - May 8, 2024
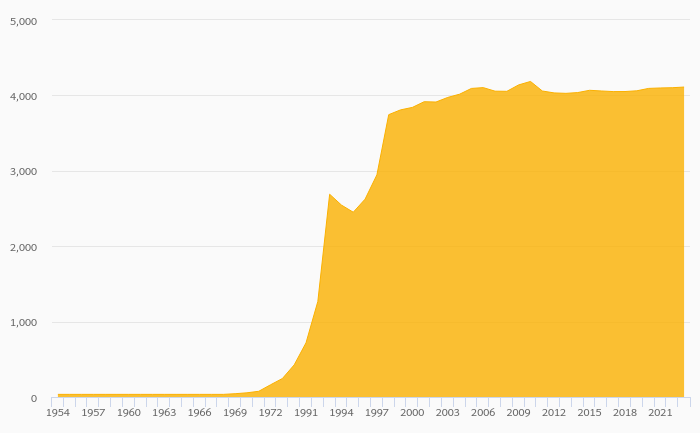
Max banka's customer loans reached CZK 3,390 mil in 2023-09-30, down 2.45% compared to the previous year. Czech banking sector provided customer loans of CZK 4,290 bil in 2023-09-30, up 1.99% when compared to the last year. Max banka accounted for 0.079% ...
By Helgi Library - May 8, 2024
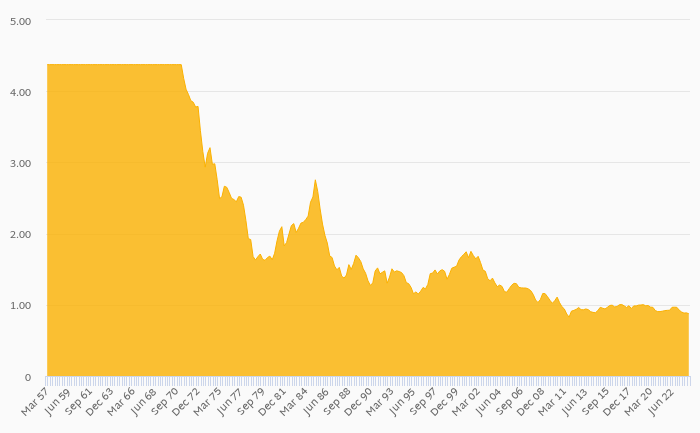
Max banka employed 140 persons in 2023-12-31, down 11.6% when compared to the previous year. Historically, the bank's workforce hit an all time high of 392 persons in 2009-12-31 and an all time low of 140 in 2023-12-31. Average cost reached USD 5,685 per month pe...
By Helgi Library - May 8, 2024
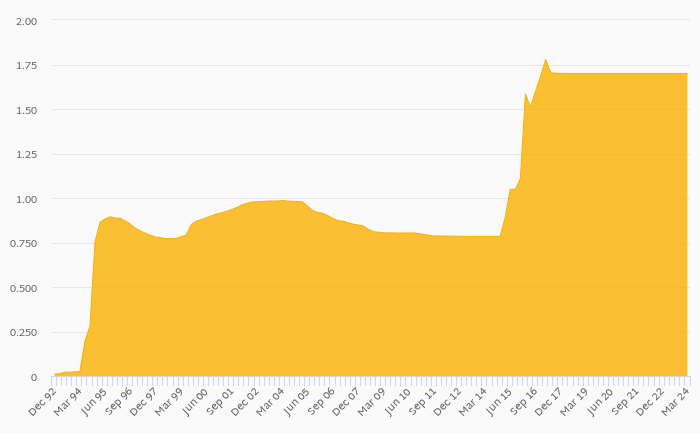
Max banka's cost to income ratio reached 52.2% in the fourth quarter of 2023, down from 69.5% when compared to the previous quarter. Historically, the bank’s costs reached an all time high of 260% of income in 1Q2022 and an all time low of 18.5% in 2Q2016. ...
By Helgi Library - May 8, 2024
Max banka's corporate deposits reached CZK -109 mil in 2023-12-31, down 111% compared to the previous year. Czech banking sector accepted corporate deposits of CZK 1,470 bil in 2023-12-31, up 3.25% when compared to the last year. Max banka accounted for -...
By Helgi Library - May 8, 2024
Max banka's retail loans reached CZK 682 mil in the fourth quarter of 2023, down 2.18% compared to the previous year. Czech banking sector provided retail loans of CZK 2,242 bil in 4Q2023, up 0.906% when compared to the last year. Max banka accounted for ...
By Helgi Library - May 8, 2024
Max banka generated total banking revenues of CZK 267 mil in the fourth quarter of 2023, up 228% when compared to the same period of last year and 56.4% when compared to the previous quarter. Historically, the bank’s revenues containing of interest, fee a...
By Helgi Library - May 8, 2024
Max banka's loans reached CZK 3,242 mil in the fourth quarter of 2023, up from CZK 3,069 mil when compared to the previous quarter and down from CZK 5,116 mil when compared to the same period of last year. Historically, the bank’s loans reached an a...
Expobank Czech Republic (formerly known as LBBW Bank CZ) is a Czech Republic-based universal commercial bank. The bank has been present on the Czech banking market since 1991 and since 2008 (when it took over the operations of Austria's BAWAG) it has been 100% owned by Landesbank Baden-Württemberg, one of the largest banks in Germany. At the end of 2014, Czech operations of LBBW have been taken over by Igor Kim and the Bank has been renamed to Expobank CZ.

Max banka has been growing its revenues and asset by 0.127% and 7.34% a year on average in the last 10 years. Its loans and deposits have grown by -18.2% and 10.4% a year during that time and loans to deposits ratio reached 5.27% at the end of 2023. The company achieved an average return on equity of 1.47% in the last decade with net profit growing 47.3% a year on average. In terms of operating efficiency, its cost to income ratio reached 62.7% in 2023, compared to 95.3% average in the last decade.
Equity represented 5.51% of total assets or 111% of loans at the end of 2023. Max banka's non-performing loans were 1.26% of total loans while provisions covered some 180% of NPLs at the end of 2023.
 Helgi Library