By Helgi Library - May 12, 2024
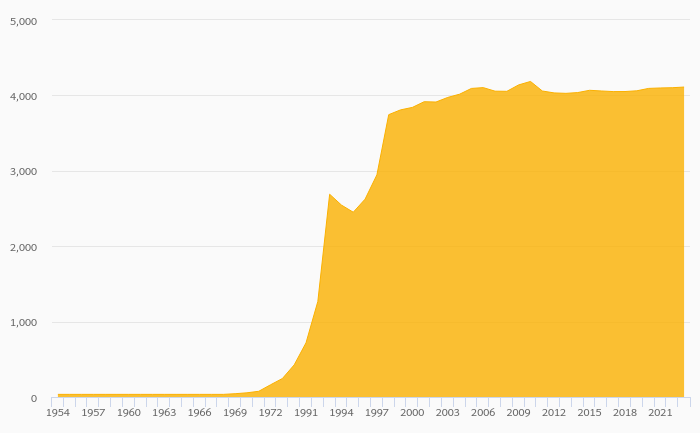
Hypotecni Banka employed 69.0 persons in 2023-12-31, down 0.648% when compared to the previous year. Historically, the bank's wo...
By Helgi Library - May 12, 2024
Hypotecni Banka's non-performing loans reached 0.644% of total loans at the end of 2023-12-31, up from 0.584% compared to the pre...
By Helgi Library - May 12, 2024
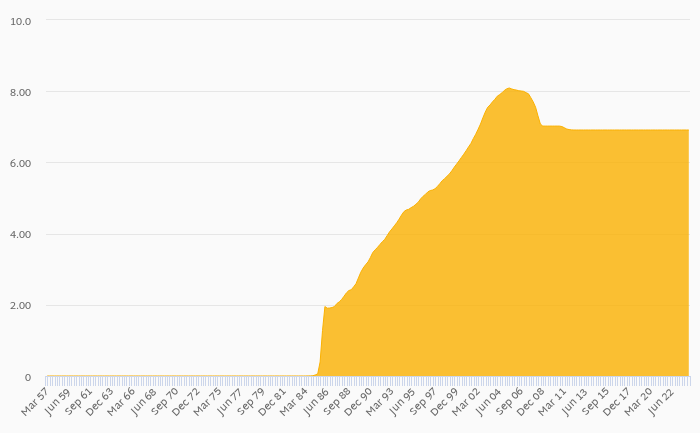
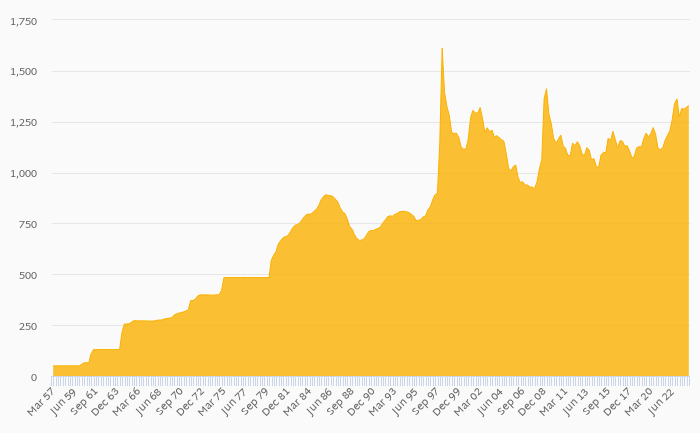
Hypotecni Banka's mortgage loans reached CZK 396,324 mil in 4Q2023, up 1.74% compared to the previous year. Czech banking secto...
| Profit Statement | 2021 | 2022 | 2023 | |
| Net Interest Income | CZK mil | 2,226 | 3,873 | 3,492 |
| Net Fee Income | CZK mil | 84.0 | 165 | 131 |
| Other Income | CZK mil | -210 | -187 | 291 |
| Total Revenues | CZK mil | 2,100 | 3,851 | 3,914 |
| Staff Cost | CZK mil | 188 | 113 | 115 |
| Operating Profit | CZK mil | 1,268 | 3,079 | 3,155 |
| Provisions | CZK mil | -549 | 12.0 | 84.0 |
| Net Profit | CZK mil | 1,478 | 2,483 | 2,481 |
| Balance Sheet | 2021 | 2022 | 2023 | |
| Interbank Loans | CZK mil | 6,625 | 8,094 | 7,603 |
| Customer Loans | CZK mil | 361,321 | 380,894 | 396,324 |
| Investments | CZK mil | 0 | 0 | 0 |
| Total Assets | CZK mil | 368,462 | 389,591 | 407,748 |
| Shareholders' Equity | CZK mil | 53,585 | 57,078 | 58,041 |
| Interbank Borrowing | CZK mil | 112 | 182 | 102 |
| Customer Deposits | CZK mil | 2.00 | 2.00 | 1.00 |
| Issued Debt Securities | CZK mil | 311,157 | 329,004 | 345,855 |
| Ratios | 2021 | 2022 | 2023 | |
| ROE | % | 2.94 | 4.49 | 4.31 |
| ROA | % | 0.413 | 0.655 | 0.622 |
| Costs (As % Of Assets) | % | 0.233 | 0.204 | 0.190 |
| Costs (As % Of Income) | % | 39.6 | 20.0 | 19.4 |
| Capital Adequacy Ratio | % | 45.2 | 49.9 | 55.7 |
| Net Interest Margin | % | 0.623 | 1.02 | 0.876 |
| Loans (As % Of Deposits) | % | 116 | 116 | 115 |
| NPLs (As % Of Loans) | % | 0.723 | 0.584 | 0.644 |
| Provisions (As % Of NPLs) | % | 30.1 | 34.4 | 31.1 |
| Growth Rates | 2021 | 2022 | 2023 | |
| Total Revenue Growth | % | -35.8 | 83.4 | 1.64 |
| Operating Cost Growth | % | -14.8 | -7.21 | -1.68 |
| Operating Profit Growth | % | -44.7 | 143 | 2.47 |
| Net Profit Growth | % | -5.62 | 68.0 | -0.081 |
| Customer Loan Growth | % | 8.23 | 5.42 | 4.05 |
| Total Asset Growth | % | 6.34 | 5.73 | 4.66 |
| Customer Deposit Growth | % | 0 | 0 | -50.0 |
| Shareholders' Equity Growth | % | 13.8 | 6.52 | 1.69 |
| Employees | 144 | 72.0 | 69.0 | |
Get all company financials in excel:
| summary | Unit | 1997 | 1998 | 1999 | 2000 | 2001 | 2002 | 2003 | 2004 | 2005 | 2006 | 2007 | 2008 | 2009 | 2010 | 2011 | 2012 | 2013 | 2014 | 2015 | 2016 | 2017 | 2018 | 2019 | 2020 | 2021 | 2022 | 2023 |
| income statement | ||||||||||||||||||||||||||||
| Net Interest Income | CZK mil | 3,939 | 3,507 | 3,448 | 2,922 | 2,226 | ||||||||||||||||||||||
| Total Revenues | CZK mil | 4,439 | 3,845 | 3,760 | 3,271 | 2,100 | ||||||||||||||||||||||
| Operating Profit | CZK mil | 3,458 | 2,853 | 2,770 | 2,295 | 1,268 | ||||||||||||||||||||||
| Net Profit | CZK mil | 2,828 | 2,354 | 2,446 | 1,566 | 1,478 | ||||||||||||||||||||||
| balance sheet | ||||||||||||||||||||||||||||
| Interbank Loans | CZK mil | 6,621 | 6,622 | 6,623 | 6,623 | 6,625 | ||||||||||||||||||||||
| Customer Loans | CZK mil | 280,409 | 299,439 | 315,556 | 333,835 | 361,321 | ||||||||||||||||||||||
| Investments | CZK mil | 1,829 | 1,883 | 0 | 0 | 0 | ||||||||||||||||||||||
| Total Assets | CZK mil | 288,314 | 308,765 | 324,053 | 346,505 | 368,462 | ||||||||||||||||||||||
| Shareholders' Equity | CZK mil | 39,391 | 42,203 | 44,600 | 47,077 | 53,585 | ||||||||||||||||||||||
| Interbank Borrowing | CZK mil | 2.00 | 2.00 | 9.00 | 141 | 112 | ||||||||||||||||||||||
| Customer Deposits | CZK mil | 398 | 57.0 | 31.0 | 2.00 | 2.00 | ||||||||||||||||||||||
| Issued Debt Securities | CZK mil | 247,011 | 264,165 | 277,396 | 295,325 | 311,157 | ||||||||||||||||||||||
| ratios | ||||||||||||||||||||||||||||
| ROE | % | ... | 7.69 | 5.77 | 5.64 | 3.42 | 2.94 | |||||||||||||||||||||
| ROA | % | ... | 1.03 | 0.789 | 0.773 | 0.467 | 0.413 | |||||||||||||||||||||
| Costs (As % Of Assets) | % | ... | 0.356 | 0.332 | 0.313 | 0.291 | 0.233 | |||||||||||||||||||||
| Costs (As % Of Income) | % | 22.1 | 25.8 | 26.3 | 29.8 | 39.6 | ||||||||||||||||||||||
| Capital Adequacy Ratio | % | ... | 37.3 | 36.5 | 42.6 | 45.9 | 45.2 | |||||||||||||||||||||
| Net Interest Margin | % | ... | 1.43 | 1.17 | 1.09 | 0.872 | 0.623 | |||||||||||||||||||||
| Interest Income (As % Of Revenues) | % | 88.7 | 91.2 | 91.7 | 89.3 | 106 | ||||||||||||||||||||||
| Fee Income (As % Of Revenues) | % | 12.6 | 11.5 | 6.62 | 5.78 | 4.00 | ||||||||||||||||||||||
| Staff Cost (As % Of Total Cost) | % | 55.5 | 54.9 | 54.2 | 47.6 | 22.6 | ||||||||||||||||||||||
| Equity (As % Of Assets) | % | 13.7 | 13.7 | 13.8 | 13.6 | 14.5 | ||||||||||||||||||||||
| Loans (As % Of Deposits) | % | 114 | 113 | 114 | 113 | 116 | ||||||||||||||||||||||
| Loans (As % Assets) | % | 97.3 | 97.0 | 97.4 | 96.3 | 98.1 | ||||||||||||||||||||||
| NPLs (As % Of Loans) | % | ... | ... | ... | 1.66 | 1.27 | 0.420 | 0.342 | 0.723 | |||||||||||||||||||
| Provisions (As % Of NPLs) | % | ... | ... | ... | 45.1 | 43.0 | 91.8 | 117 | 30.1 | |||||||||||||||||||
| valuation | ||||||||||||||||||||||||||||
| Book Value Per Share Growth | % | ... | -12.4 | -11.0 | -1.68 | -15.3 | -23.8 |
| income statement | Unit | 1997 | 1998 | 1999 | 2000 | 2001 | 2002 | 2003 | 2004 | 2005 | 2006 | 2007 | 2008 | 2009 | 2010 | 2011 | 2012 | 2013 | 2014 | 2015 | 2016 | 2017 | 2018 | 2019 | 2020 | 2021 | 2022 | 2023 |
| income statement | ||||||||||||||||||||||||||||
| Interest Income | CZK mil | 6,811 | 7,201 | 8,142 | 7,355 | 7,111 | ||||||||||||||||||||||
| Interest Cost | CZK mil | 2,872 | 3,694 | 4,694 | 4,433 | 4,885 | ||||||||||||||||||||||
| Net Interest Income | CZK mil | 3,939 | 3,507 | 3,448 | 2,922 | 2,226 | ||||||||||||||||||||||
| Net Fee Income | CZK mil | 559 | 443 | 249 | 189 | 84.0 | ||||||||||||||||||||||
| Fee Income | CZK mil | ... | ... | ... | ... | ... | ... | ... | ... | ... | ... | ... | ... | ... | ... | ... | ... | ... | ... | ... | ... | ... | ... | 302 | 269 | 257 | ||
| Fee Expense | CZK mil | ... | ... | ... | ... | ... | ... | ... | ... | ... | ... | ... | ... | ... | ... | ... | ... | ... | ... | ... | ... | ... | ... | 53.0 | 80.0 | 173 | ||
| Other Income | CZK mil | -59.0 | -105 | 63.0 | 160 | -210 | ||||||||||||||||||||||
| Total Revenues | CZK mil | 4,439 | 3,845 | 3,760 | 3,271 | 2,100 | ||||||||||||||||||||||
| Staff Cost | CZK mil | 544 | 545 | 536 | 465 | 188 | ||||||||||||||||||||||
| Depreciation | CZK mil | 64.0 | 77.0 | 131 | 132 | 115 | ||||||||||||||||||||||
| Other Cost | CZK mil | 373 | 370 | 323 | 379 | 529 | ||||||||||||||||||||||
| Operating Cost | CZK mil | 981 | 992 | 990 | 976 | 832 | ||||||||||||||||||||||
| Operating Profit | CZK mil | 3,458 | 2,853 | 2,770 | 2,295 | 1,268 | ||||||||||||||||||||||
| Provisions | CZK mil | -21.0 | -140 | -252 | 358 | -549 | ||||||||||||||||||||||
| Extra and Other Cost | CZK mil | 0 | 0 | 0.201 | 0 | 0 | ||||||||||||||||||||||
| Pre-Tax Profit | CZK mil | 3,479 | 2,993 | 3,022 | 1,937 | 1,817 | ||||||||||||||||||||||
| Tax | CZK mil | 651 | 639 | 576 | 371 | 339 | ||||||||||||||||||||||
| Minorities | CZK mil | 0 | 0 | 0 | 0 | 0 | ||||||||||||||||||||||
| Net Profit | CZK mil | 2,828 | 2,354 | 2,446 | 1,566 | 1,478 | ||||||||||||||||||||||
| Net Profit Avail. to Common | CZK mil | 2,828 | 2,354 | 2,446 | 1,566 | 1,478 | ||||||||||||||||||||||
| Dividends | CZK mil | ... | ... | ... | ... | ... | ... | ... | ... | ... | ... | 2,828 | 3,554 | 2,446 | 1,568 | 1,478 | ... | |||||||||||
| growth rates | ||||||||||||||||||||||||||||
| Net Interest Income Growth | % | ... | -12.4 | -11.0 | -1.68 | -15.3 | -23.8 | |||||||||||||||||||||
| Net Fee Income Growth | % | ... | 6.88 | -20.8 | -43.8 | -24.1 | -55.6 | |||||||||||||||||||||
| Total Revenue Growth | % | ... | -12.3 | -13.4 | -2.21 | -13.0 | -35.8 | |||||||||||||||||||||
| Operating Cost Growth | % | ... | -8.23 | 1.12 | -0.202 | -1.41 | -14.8 | |||||||||||||||||||||
| Operating Profit Growth | % | ... | -13.4 | -17.5 | -2.91 | -17.1 | -44.7 | |||||||||||||||||||||
| Pre-Tax Profit Growth | % | ... | -11.8 | -14.0 | 0.969 | -35.9 | -6.20 | |||||||||||||||||||||
| Net Profit Growth | % | ... | -11.8 | -16.8 | 3.91 | -36.0 | -5.62 | |||||||||||||||||||||
| market share | ||||||||||||||||||||||||||||
| Market Share in Revenues | % | 2.48 | 2.02 | 1.86 | 1.81 | 1.14 | ||||||||||||||||||||||
| Market Share in Net Profit | % | 3.75 | 2.89 | 2.68 | 3.30 | 2.10 | ||||||||||||||||||||||
| Market Share in Employees | % | ... | 1.31 | 1.26 | 1.19 | 1.03 | 0.363 | |||||||||||||||||||||
| Market Share in Branches | % | ... | 1.54 | 1.53 | 1.53 | 1.73 | 0.063 |
| balance sheet | Unit | 1997 | 1998 | 1999 | 2000 | 2001 | 2002 | 2003 | 2004 | 2005 | 2006 | 2007 | 2008 | 2009 | 2010 | 2011 | 2012 | 2013 | 2014 | 2015 | 2016 | 2017 | 2018 | 2019 | 2020 | 2021 | 2022 | 2023 |
| balance sheet | ||||||||||||||||||||||||||||
| Cash & Cash Equivalents | CZK mil | 725 | 1,619 | 632 | 1,864 | 433 | ||||||||||||||||||||||
| Interbank Loans | CZK mil | 6,621 | 6,622 | 6,623 | 6,623 | 6,625 | ||||||||||||||||||||||
| Customer Loans | CZK mil | 280,409 | 299,439 | 315,556 | 333,835 | 361,321 | ||||||||||||||||||||||
| Retail Loans | CZK mil | 280,409 | 299,439 | 315,556 | 333,835 | 361,321 | ||||||||||||||||||||||
| Mortgage Loans | CZK mil | 280,409 | 299,439 | 315,556 | 333,835 | 361,321 | ||||||||||||||||||||||
| Consumer Loans | CZK mil | 0 | 0 | 0 | 0 | 0 | ||||||||||||||||||||||
| Investments | CZK mil | 1,829 | 1,883 | 0 | 0 | 0 | ||||||||||||||||||||||
| Property and Equipment | CZK mil | 369 | 458 | 393 | 304 | 75.0 | ||||||||||||||||||||||
| Intangible Assets | CZK mil | ... | ... | ... | ... | ... | ... | ... | ... | ... | ... | ... | ... | ... | ... | ... | ... | ... | ... | ... | ... | ... | ... | 468 | 536 | 563 | ||
| Total Assets | CZK mil | 288,314 | 308,765 | 324,053 | 346,505 | 368,462 | ||||||||||||||||||||||
| Shareholders' Equity | CZK mil | 39,391 | 42,203 | 44,600 | 47,077 | 53,585 | ||||||||||||||||||||||
| Of Which Minority Interest | CZK mil | 0 | 0 | 0 | 0 | 0 | ||||||||||||||||||||||
| Liabilities | CZK mil | 248,923 | 266,562 | 279,453 | 299,428 | 314,877 | ||||||||||||||||||||||
| Interbank Borrowing | CZK mil | 2.00 | 2.00 | 9.00 | 141 | 112 | ||||||||||||||||||||||
| Customer Deposits | CZK mil | 398 | 57.0 | 31.0 | 2.00 | 2.00 | ||||||||||||||||||||||
| Retail Deposits | CZK mil | ... | ... | ... | ... | ... | ... | ... | ... | ... | ... | ... | ... | ... | ... | ... | 298 | 0 | 0 | 0 | 0 | |||||||
| Corporate Deposits | CZK mil | ... | ... | ... | ... | ... | ... | ... | ... | ... | ... | ... | ... | ... | ... | ... | 100 | 57.0 | 0 | 0 | 0 | |||||||
| Issued Debt Securities | CZK mil | 247,011 | 264,165 | 277,396 | 295,325 | 311,157 | ||||||||||||||||||||||
| Other Liabilities | CZK mil | 1,512 | 2,338 | 2,017 | 3,960 | 3,606 | ||||||||||||||||||||||
| asset quality | ||||||||||||||||||||||||||||
| Non-Performing Loans | CZK mil | ... | ... | ... | 4,700 | 3,815 | 1,357 | 1,182 | 2,617 | |||||||||||||||||||
| Gross Loans | CZK mil | ... | ... | ... | 282,531 | 301,081 | 323,124 | 345,584 | 362,109 | |||||||||||||||||||
| Risk-Weighted Assets | CZK mil | ... | ... | ... | 95,221 | 106,331 | 95,758 | 97,177 | 112,444 | |||||||||||||||||||
| Total Provisions | CZK mil | ... | ... | ... | 2,122 | 1,642 | 1,246 | 1,383 | 788 | |||||||||||||||||||
| growth rates | ||||||||||||||||||||||||||||
| Customer Loan Growth | % | ... | 10.4 | 6.79 | 5.38 | 5.79 | 8.23 | |||||||||||||||||||||
| Retail Loan Growth | % | ... | 10.4 | 6.79 | 5.38 | 5.79 | 8.23 | |||||||||||||||||||||
| Mortgage Loan Growth | % | ... | 10.4 | 6.79 | 5.38 | 5.79 | 8.23 | |||||||||||||||||||||
| Total Asset Growth | % | ... | 9.83 | 7.09 | 4.95 | 6.93 | 6.34 | |||||||||||||||||||||
| Shareholders' Equity Growth | % | ... | 15.3 | 7.14 | 5.68 | 5.55 | 13.8 | |||||||||||||||||||||
| Customer Deposit Growth | % | ... | -0.995 | -85.7 | -45.6 | -93.5 | 0 | |||||||||||||||||||||
| Retail Deposit Growth | % | ... | ... | ... | ... | ... | ... | ... | ... | ... | ... | ... | ... | ... | ... | ... | ... | 5.30 | -100 | ... | ... | ... | ... | ... | ||||
| Corporate Deposit Growth | % | ... | ... | ... | ... | ... | ... | ... | ... | ... | ... | ... | ... | ... | ... | ... | ... | -16.0 | -43.0 | -100 | ... | ... | ... | ... | ||||
| market share | ||||||||||||||||||||||||||||
| Market Share in Customer Loans | % | 9.09 | 9.06 | 9.15 | 9.28 | 9.39 | ... | |||||||||||||||||||||
| Market Share in Retail Loans | % | 18.4 | 18.2 | 18.1 | 18.0 | 17.7 | ||||||||||||||||||||||
| Market Share in Consumer Loans | % | 0 | 0 | 0 | 0 | 0 | ||||||||||||||||||||||
| Market Share in Mortgage Loans | % | 24.4 | 24.0 | 23.7 | 23.3 | 22.7 | ||||||||||||||||||||||
| Market Share in Total Assets | % | 4.12 | 4.24 | 4.28 | 4.35 | 4.32 | ||||||||||||||||||||||
| Market Share in Customer Deposits | % | 0.010 | 0.001 | < 0.001 | < 0.001 | < 0.001 | ||||||||||||||||||||||
| Market Share in Retail Deposits | % | ... | ... | ... | ... | ... | ... | ... | ... | ... | ... | ... | ... | ... | ... | ... | 0.013 | 0 | 0 | 0 | 0 | |||||||
| Market Share in Corporate Deposits | % | ... | ... | ... | ... | ... | ... | ... | ... | ... | ... | ... | ... | ... | ... | ... | 0.010 | 0.005 | 0 | 0 | 0 |
| ratios | Unit | 1997 | 1998 | 1999 | 2000 | 2001 | 2002 | 2003 | 2004 | 2005 | 2006 | 2007 | 2008 | 2009 | 2010 | 2011 | 2012 | 2013 | 2014 | 2015 | 2016 | 2017 | 2018 | 2019 | 2020 | 2021 | 2022 | 2023 |
| ROE | % | ... | 7.69 | 5.77 | 5.64 | 3.42 | 2.94 | |||||||||||||||||||||
| ROTE | % | ... | ... | ... | ... | ... | ... | ... | ... | ... | ... | ... | ... | ... | ... | ... | ... | ... | ... | ... | ... | ... | ... | ... | 3.45 | 2.97 | ||
| ROE (@ 15% of RWA) | % | ... | ... | ... | ... | 19.1 | 15.6 | 16.1 | 10.8 | 9.40 | ||||||||||||||||||
| ROA | % | ... | 1.03 | 0.789 | 0.773 | 0.467 | 0.413 | |||||||||||||||||||||
| Return on Loans | % | 1.06 | 0.812 | 0.795 | 0.482 | 0.425 | ||||||||||||||||||||||
| Operating Profit (As % of RWA) | % | ... | ... | ... | ... | 3.51 | 2.83 | 2.74 | 2.38 | 1.21 | ||||||||||||||||||
| Costs (As % Of Assets) | % | ... | 0.356 | 0.332 | 0.313 | 0.291 | 0.233 | |||||||||||||||||||||
| Costs (As % Of Income) | % | 22.1 | 25.8 | 26.3 | 29.8 | 39.6 | ||||||||||||||||||||||
| Costs (As % Of Loans) | % | ... | 0.367 | 0.342 | 0.322 | 0.301 | 0.239 | |||||||||||||||||||||
| Costs (As % Of Loans & Deposits) | % | ... | 0.367 | 0.342 | 0.322 | 0.301 | 0.239 | |||||||||||||||||||||
| Capital Adequacy Ratio | % | ... | 37.3 | 36.5 | 42.6 | 45.9 | 45.2 | |||||||||||||||||||||
| Tier 1 Ratio | % | ... | 37.3 | 36.5 | 42.6 | 45.9 | 45.2 | |||||||||||||||||||||
| Net Interest Margin | % | ... | 1.43 | 1.17 | 1.09 | 0.872 | 0.623 | |||||||||||||||||||||
| Interest Spread | % | ... | 1.27 | 0.979 | 0.854 | 0.662 | 0.399 | |||||||||||||||||||||
| Asset Yield | % | ... | 2.47 | 2.41 | 2.57 | 2.19 | 1.99 | |||||||||||||||||||||
| Revenues (As % of RWA) | % | ... | ... | ... | ... | 4.51 | 3.82 | 3.72 | 3.39 | 2.00 | ||||||||||||||||||
| Cost Of Liabilities | % | ... | 1.20 | 1.43 | 1.72 | 1.53 | 1.59 | |||||||||||||||||||||
| Payout Ratio | % | ... | ... | ... | ... | ... | ... | ... | ... | ... | ... | 100 | 151 | 100 | 100 | 100 | ... | |||||||||||
| Interest Income (As % Of Revenues) | % | 88.7 | 91.2 | 91.7 | 89.3 | 106 | ||||||||||||||||||||||
| Fee Income (As % Of Revenues) | % | 12.6 | 11.5 | 6.62 | 5.78 | 4.00 | ||||||||||||||||||||||
| Other Income (As % Of Revenues) | % | -1.33 | -2.73 | 1.68 | 4.89 | -10.0 | ||||||||||||||||||||||
| Staff Cost (As % Of Total Cost) | % | 55.5 | 54.9 | 54.2 | 47.6 | 22.6 | ||||||||||||||||||||||
| Equity (As % Of Assets) | % | 13.7 | 13.7 | 13.8 | 13.6 | 14.5 | ||||||||||||||||||||||
| Equity (As % Of Loans) | % | 14.0 | 14.1 | 14.1 | 14.1 | 14.8 | ||||||||||||||||||||||
| Loans (As % Of Deposits) | % | 114 | 113 | 114 | 113 | 116 | ||||||||||||||||||||||
| Loans (As % Assets) | % | 97.3 | 97.0 | 97.4 | 96.3 | 98.1 | ||||||||||||||||||||||
| NPLs (As % Of Loans) | % | ... | ... | ... | 1.66 | 1.27 | 0.420 | 0.342 | 0.723 | |||||||||||||||||||
| Provisions (As % Of NPLs) | % | ... | ... | ... | 45.1 | 43.0 | 91.8 | 117 | 30.1 | |||||||||||||||||||
| Provisions (As % Of Loans) | % | ... | ... | ... | 0.757 | 0.548 | 0.395 | 0.414 | 0.218 | |||||||||||||||||||
| Cost of Provisions (As % Of Loans) | % | ... | -0.008 | -0.048 | -0.082 | 0.110 | -0.158 |
| other data | Unit | 1997 | 1998 | 1999 | 2000 | 2001 | 2002 | 2003 | 2004 | 2005 | 2006 | 2007 | 2008 | 2009 | 2010 | 2011 | 2012 | 2013 | 2014 | 2015 | 2016 | 2017 | 2018 | 2019 | 2020 | 2021 | 2022 | 2023 |
| Branches | ... | 30.0 | 30.0 | 29.0 | 29.0 | 1.00 | ||||||||||||||||||||||
| Employees | ... | 548 | 526 | 497 | 419 | 144 | ||||||||||||||||||||||
| Employees Per Bank Branch | ... | 18.3 | 17.5 | 17.1 | 14.4 | 144 | ||||||||||||||||||||||
| Cost Per Employee | USD per month | ... | 3,525 | 3,946 | 3,990 | 4,203 | 5,021 | |||||||||||||||||||||
| Cost Per Employee (Local Currency) | CZK per month | ... | 82,725 | 86,343 | 89,944 | 92,482 | 108,796 |
| customer breakdown | Unit | 1997 | 1998 | 1999 | 2000 | 2001 | 2002 | 2003 | 2004 | 2005 | 2006 | 2007 | 2008 | 2009 | 2010 | 2011 | 2012 | 2013 | 2014 | 2015 | 2016 | 2017 | 2018 | 2019 | 2020 | 2021 | 2022 | 2023 |
| Customers | mil | ... | ... | ... | ... | ... | ... | ... | ... | 0.201 | 0.206 | 0.223 | 0.230 | 0.240 | ||||||||||||||
| Number of Mortgages | mil | ... | ... | ... | ... | ... | ... | ... | ... | 0.201 | 0.206 | 0.223 | ... | ... | ... | ... | ||||||||||||
| Average Size of Mortgage Loan | CZK | ... | ... | ... | ... | ... | ... | ... | ... | 1,393,000 | 1,451,000 | 1,414,230 | ... | ... | ... | ... | ||||||||||||
| Mortgages (As % of Total Clients) | % | ... | ... | ... | ... | ... | ... | ... | ... | 100 | 100 | 100 | ... | ... | ... | ... | ||||||||||||
| Revenue per Customer (Local Currency) | CZK | ... | ... | ... | ... | ... | ... | ... | ... | 22,052 | 18,632 | 16,851 | 14,222 | 8,750 | ||||||||||||||
| Net Profit per Customer (Local Currency) | CZK | ... | ... | ... | ... | ... | ... | ... | ... | 14,049 | 11,407 | 10,962 | 6,809 | 6,158 | ||||||||||||||
| Loan per Customer (Local Currency) | CZK | ... | ... | ... | ... | ... | ... | ... | ... | 1,393,000 | 1,451,000 | 1,414,230 | 1,451,457 | 1,505,504 | ||||||||||||||
| Deposit per Customer (Local Currency) | CZK | ... | ... | ... | ... | ... | ... | ... | ... | 1,977 | 276 | 139 | 8.70 | 8.33 | ||||||||||||||
| Revenue per Customer | USD | ... | ... | ... | ... | ... | ... | ... | ... | 940 | 852 | 747 | 646 | 404 | ||||||||||||||
| Net Profit per Customer | USD | ... | ... | ... | ... | ... | ... | ... | ... | 599 | 521 | 486 | 309 | 284 | ||||||||||||||
| Loan per Customer | USD | ... | ... | ... | ... | ... | ... | ... | ... | 65,427 | 64,586 | 62,518 | 67,866 | 68,585 | ||||||||||||||
| Deposit per Customer | USD | ... | ... | ... | ... | ... | ... | ... | ... | 92.9 | 12.3 | 6.14 | 0.407 | 0.380 |
Get all company financials in excel:


By Helgi Library - May 12, 2024
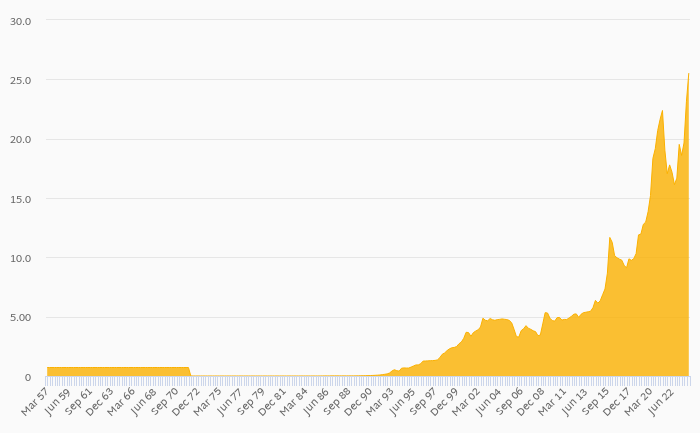
Hypotecni Banka's customer loans reached CZK 389,546 mil in 2023-09-30, up 0.988% compared to the previous year. Czech banking sector provided customer loans of CZK 4,290 bil in 2023-09-30, up 1.99% when compared to the last year. Hypotecni Banka accounte...
By Helgi Library - May 12, 2024
Hypotecni Banka's cost to income ratio reached -4.18% in the fourth quarter of 2023, down from 35.7% when compared to the previous quarter. Historically, the bank’s costs reached an all time high of 65.9% of income in 4Q2021 and an all time low of -4.18% in ...
By Helgi Library - May 12, 2024
Hypotecni Banka's retail loans reached CZK 396,324 mil in the fourth quarter of 2023, up 1.74% compared to the previous year. Czech banking sector provided retail loans of CZK 2,242 bil in 4Q2023, up 0.906% when compared to the last year. Hypotecni Banka ...
By Helgi Library - May 12, 2024
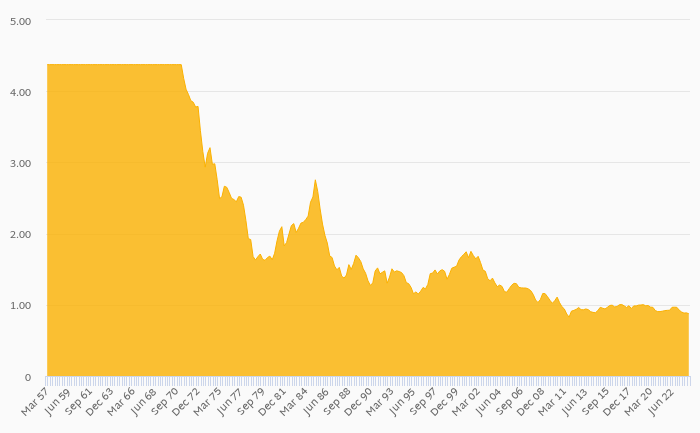
Hypotecni Banka's capital adequacy ratio reached 55.7% at the end of fourth quarter of 2023, up from 52.1% when compared to the previous quarter. Historically, the bank’s capital ratio hit an all time high of 56.4% in 2Q2008 and an all time low of 8.16% in 4Q2002. ...
By Helgi Library - May 12, 2024
Hypotecni Banka made a net profit of CZK 586 mil under revenues of CZK 884 mil in the fourth quarter of 2023, down 39.8% and 31% respectively when compared to the same period last year. Historically, the bank’s net profit reached an all time high of CZK 973 m...
By Helgi Library - May 12, 2024
Hypotecni Banka made a net profit of CZK 586 mil in the fourth quarter of 2023, down 39.8% when compared to the same period of last year. This implies a return on equity of 4.06%. Historically, the bank’s net profit reached an all time high of CZK 973 mil in 4Q20...
By Helgi Library - May 12, 2024
Hypotecni Banka's customer deposits reached CZK 1.00 mil in 2023-12-31, down 99.4% compared to the previous year. Czech banking sector accepted customer deposits of CZK 6,701 bil in 2023-12-31, down 3.35% when compared to the last year. Hypotecni Banka ac...
By Helgi Library - May 12, 2024
Hypotecni Banka generated total banking revenues of CZK 884 mil in 2023-12-31, down 1.13% compared to the previous year. Czech banking sector banking sector generated total revenues of CZK 58,954 mil in 2023-12-31, up 3.14% when compared to the last y...
By Helgi Library - May 12, 2024
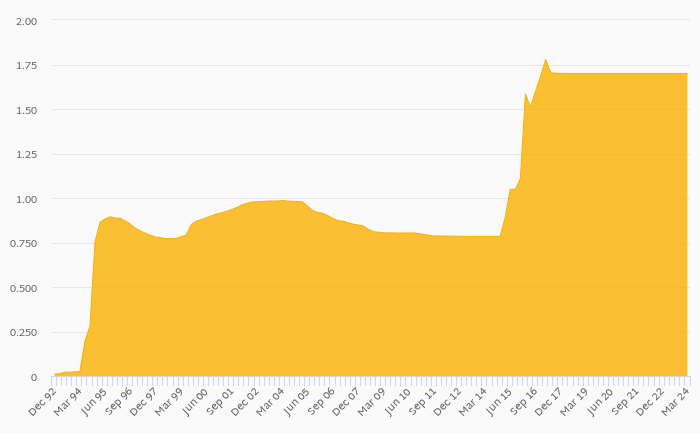
Hypotecni Banka's net interest margin amounted to 0.794% in the fourth quarter of 2023, down from 0.815% when compared to the previous quarter. Historically, the bank’s net interest margin reached an all time high of 9.76% in 4Q2000 and an all time low of ...
By Helgi Library - May 12, 2024
Hypotecni Banka's retail deposits reached CZK 0 mil in 2023-12-31, down 0% compared to the previous year. Czech banking sector accepted retail deposits of CZK 3,651 bil in 2023-12-31, up 2.05% when compared to the last year. Hypotecni Banka accounted for ...
Hypoteční Banka is the Czech Republic's largest mortgage lender with a market share of around 25%. Despite being a 100% subsidiary of ČSOB, Hypoteční has kept its distinctive brand name and relatively high level of independence. The numbers suggest that the bank possesses all the right ingredients for success; it is exposed to the fastest-growing area of banking (mortgage lending), it is extremely cost-efficient and its asset quality remains under good control. When adjusted for hefty overcapitalisation, Hypoteční Banka’s ROE jumps to impressive 20's% being on eof the most profitable banks on the Czech market in the last decade.

Hypotecni Banka has been growing its revenues and asset by -2.55% and 6.66% a year on average in the last 10 years. Its loans and deposits have grown by 7.29% and -46.4% a year during that time and loans to deposits ratio reached 115% at the end of 2023. The company achieved an average return on equity of 6.35% in the last decade with net profit growing -1.40% a year on average. In terms of operating efficiency, its cost to income ratio reached 19.4% in 2023, compared to 24.0% average in the last decade.
Equity represented 14.2% of total assets or 14.6% of loans at the end of 2023. Hypotecni Banka's non-performing loans were 0.644% of total loans while provisions covered some 31.1% of NPLs at the end of 2023.
 Helgi Library