By Helgi Library - May 8, 2024
Banka Creditas generated total banking revenues of CZK 659 mil in 2023-12-31, up 36.7% compared to the previous year. Czec...
By Helgi Library - May 8, 2024
Banka Creditas's customer deposits reached CZK 115,444 mil in 2023-12-31, up 2.70% compared to the previous year. Czech banking...
By Helgi Library - May 8, 2024
Banka Creditas's customer loans reached CZK 30,500 mil in 2023-09-30, up 5.17% compared to the previous year. Czech banking sec...
| Profit Statement | 2021 | 2022 | 2023 | |
| Net Interest Income | CZK mil | 941 | 1,615 | 2,293 |
| Net Fee Income | CZK mil | 14.4 | 34.3 | 69.0 |
| Other Income | CZK mil | -6.50 | 109 | 518 |
| Total Revenues | CZK mil | 949 | 1,758 | 2,880 |
| Staff Cost | CZK mil | 348 | 519 | 781 |
| Operating Profit | CZK mil | 83.0 | 558 | 1,028 |
| Provisions | CZK mil | 59.4 | 181 | -112 |
| Net Profit | CZK mil | 23.3 | 1,595 | 1,038 |
| Balance Sheet | 2021 | 2022 | 2023 | |
| Interbank Loans | CZK mil | 23,758 | 72,126 | 120,120 |
| Customer Loans | CZK mil | 23,375 | 30,159 | 34,866 |
| Investments | CZK mil | 13,572 | 19,784 | 28,237 |
| Total Assets | CZK mil | 62,883 | 126,258 | 191,080 |
| Shareholders' Equity | CZK mil | 4,562 | 6,192 | 10,244 |
| Interbank Borrowing | CZK mil | 369 | 2,649 | 146 |
| Customer Deposits | CZK mil | 56,131 | 114,050 | 175,564 |
| Issued Debt Securities | CZK mil | 1,202 | 1,967 | 3,901 |
| Ratios | 2021 | 2022 | 2023 | |
| ROE | % | 0.512 | 29.7 | 12.6 |
| ROA | % | 0.036 | 1.69 | 0.654 |
| Costs (As % Of Assets) | % | 1.34 | 1.27 | 1.17 |
| Costs (As % Of Income) | % | 91.3 | 68.2 | 64.3 |
| Capital Adequacy Ratio | % | 21.4 | 26.5 | 33.8 |
| Net Interest Margin | % | 1.45 | 1.71 | 1.45 |
| Loans (As % Of Deposits) | % | 41.6 | 26.4 | 19.9 |
| NPLs (As % Of Loans) | % | 8.78 | 5.67 | 2.50 |
| Provisions (As % Of NPLs) | % | 21.1 | 34.3 | 53.1 |
| Growth Rates | 2021 | 2022 | 2023 | |
| Total Revenue Growth | % | -13.1 | 85.2 | 63.8 |
| Operating Cost Growth | % | 5.42 | 38.5 | 54.4 |
| Operating Profit Growth | % | -69.3 | 573 | 84.1 |
| Net Profit Growth | % | -79.6 | 6,745 | -34.9 |
| Customer Loan Growth | % | 48.5 | 29.0 | 15.6 |
| Total Asset Growth | % | -5.73 | 101 | 51.3 |
| Customer Deposit Growth | % | -8.61 | 103 | 53.9 |
| Shareholders' Equity Growth | % | 0.529 | 35.7 | 65.4 |
| Employees | 421 | 649 | 659 | |
Get all company financials in excel:
| summary | Unit | 2002 | 2003 | 2004 | 2005 | 2006 | 2007 | 2008 | 2009 | 2010 | 2011 | 2012 | 2013 | 2014 | 2015 | 2016 | 2017 | 2018 | 2019 | 2020 | 2021 | 2022 | 2023 |
| income statement | |||||||||||||||||||||||
| Net Interest Income | CZK mil | 338 | 775 | 1,035 | 905 | 941 | |||||||||||||||||
| Total Revenues | CZK mil | 410 | 796 | 1,109 | 1,092 | 949 | |||||||||||||||||
| Operating Profit | CZK mil | -28.3 | 263 | 367 | 271 | 83.0 | |||||||||||||||||
| Net Profit | CZK mil | 66.2 | 171 | 263 | 114 | 23.3 | |||||||||||||||||
| balance sheet | |||||||||||||||||||||||
| Interbank Loans | CZK mil | 18,025 | 23,809 | 53,712 | 42,700 | 23,758 | |||||||||||||||||
| Customer Loans | CZK mil | 11,334 | 13,840 | 14,664 | 15,739 | 23,375 | |||||||||||||||||
| Investments | CZK mil | 864 | 1,676 | 2,635 | 6,280 | 13,572 | |||||||||||||||||
| Total Assets | CZK mil | 31,697 | 40,968 | 73,387 | 66,707 | 62,883 | |||||||||||||||||
| Shareholders' Equity | CZK mil | 2,243 | 3,411 | 4,424 | 4,538 | 4,562 | |||||||||||||||||
| Interbank Borrowing | CZK mil | 4,007 | 2,405 | 0.600 | 45.6 | 369 | |||||||||||||||||
| Customer Deposits | CZK mil | 25,349 | 35,002 | 68,525 | 61,416 | 56,131 | |||||||||||||||||
| Issued Debt Securities | CZK mil | 28.9 | 16.1 | 0 | 327 | 1,202 | |||||||||||||||||
| ratios | |||||||||||||||||||||||
| ROE | % | ... | 3.49 | 6.06 | 6.71 | 2.55 | 0.512 | ||||||||||||||||
| ROA | % | ... | 0.305 | 0.471 | 0.459 | 0.163 | 0.036 | ||||||||||||||||
| Costs (As % Of Assets) | % | ... | 2.02 | 1.47 | 1.30 | 1.17 | 1.34 | ||||||||||||||||
| Costs (As % Of Income) | % | 107 | 67.0 | 66.9 | 75.2 | 91.3 | |||||||||||||||||
| Capital Adequacy Ratio | % | ... | ... | ... | ... | ... | 12.5 | 16.5 | 19.5 | 20.1 | 21.4 | ||||||||||||
| Net Interest Margin | % | ... | 1.56 | 2.13 | 1.81 | 1.29 | 1.45 | ||||||||||||||||
| Interest Income (As % Of Revenues) | % | 82.4 | 97.4 | 93.3 | 82.8 | 99.2 | |||||||||||||||||
| Fee Income (As % Of Revenues) | % | -1.44 | -1.17 | 0.712 | 0.439 | 1.52 | |||||||||||||||||
| Staff Cost (As % Of Total Cost) | % | 36.1 | 35.6 | 35.4 | 33.7 | 40.2 | |||||||||||||||||
| Equity (As % Of Assets) | % | 7.08 | 8.33 | 6.03 | 6.80 | 7.25 | |||||||||||||||||
| Loans (As % Of Deposits) | % | 44.7 | 39.5 | 21.4 | 25.6 | 41.6 | |||||||||||||||||
| Loans (As % Assets) | % | 35.8 | 33.8 | 20.0 | 23.6 | 37.2 | |||||||||||||||||
| NPLs (As % Of Loans) | % | ... | ... | ... | ... | ... | 9.76 | 7.65 | 8.68 | 17.5 | 8.78 | ||||||||||||
| Provisions (As % Of NPLs) | % | ... | ... | ... | ... | ... | 17.6 | 26.6 | 24.6 | 14.8 | 21.1 | ||||||||||||
| valuation | |||||||||||||||||||||||
| Book Value Per Share Growth | % | ... | 9.88 | 129 | 33.5 | -12.6 | 4.03 |
| income statement | Unit | 2002 | 2003 | 2004 | 2005 | 2006 | 2007 | 2008 | 2009 | 2010 | 2011 | 2012 | 2013 | 2014 | 2015 | 2016 | 2017 | 2018 | 2019 | 2020 | 2021 | 2022 | 2023 |
| income statement | |||||||||||||||||||||||
| Interest Income | CZK mil | 655 | 1,056 | 1,776 | 1,581 | 1,437 | |||||||||||||||||
| Interest Cost | CZK mil | 317 | 281 | 741 | 676 | 495 | |||||||||||||||||
| Net Interest Income | CZK mil | 338 | 775 | 1,035 | 905 | 941 | |||||||||||||||||
| Net Fee Income | CZK mil | -5.90 | -9.30 | 7.90 | 4.80 | 14.4 | |||||||||||||||||
| Fee Income | CZK mil | ... | ... | ... | ... | ... | ... | ... | ... | ... | ... | ... | ... | ... | ... | ... | ... | ... | 42.6 | 38.8 | 53.2 | ||
| Fee Expense | CZK mil | ... | ... | ... | ... | ... | ... | ... | ... | ... | ... | ... | ... | ... | ... | ... | ... | ... | 34.7 | 34.0 | 38.8 | ||
| Other Income | CZK mil | 78.1 | 30.0 | 66.0 | 183 | -6.50 | |||||||||||||||||
| Total Revenues | CZK mil | 410 | 796 | 1,109 | 1,092 | 949 | |||||||||||||||||
| Staff Cost | CZK mil | 158 | 190 | 263 | 277 | 348 | |||||||||||||||||
| Depreciation | CZK mil | 51.7 | 92.5 | 180 | 231 | 245 | |||||||||||||||||
| Other Cost | CZK mil | 229 | 251 | 299 | 314 | 273 | |||||||||||||||||
| Operating Cost | CZK mil | 439 | 533 | 742 | 822 | 866 | |||||||||||||||||
| Operating Profit | CZK mil | -28.3 | 263 | 367 | 271 | 83.0 | |||||||||||||||||
| Provisions | CZK mil | -103 | 35.4 | 30.9 | 106 | 59.4 | |||||||||||||||||
| Extra and Other Cost | CZK mil | 0 | 0 | 0 | 0 | -1.60 | |||||||||||||||||
| Pre-Tax Profit | CZK mil | 74.8 | 227 | 336 | 165 | 25.2 | |||||||||||||||||
| Tax | CZK mil | 8.60 | 55.8 | 73.7 | 50.2 | 1.90 | |||||||||||||||||
| Minorities | CZK mil | 0 | 0 | 0 | 0 | 0 | |||||||||||||||||
| Net Profit | CZK mil | 66.2 | 171 | 263 | 114 | 23.3 | |||||||||||||||||
| Net Profit Avail. to Common | CZK mil | 66.2 | 171 | 263 | 114 | 23.3 | |||||||||||||||||
| growth rates | |||||||||||||||||||||||
| Net Interest Income Growth | % | ... | 9.88 | 129 | 33.5 | -12.6 | 4.03 | ||||||||||||||||
| Net Fee Income Growth | % | ... | 5.36 | 57.6 | -185 | -39.2 | 200 | ||||||||||||||||
| Total Revenue Growth | % | ... | 21.4 | 94.0 | 39.3 | -1.51 | -13.1 | ||||||||||||||||
| Operating Cost Growth | % | ... | 39.2 | 21.6 | 39.1 | 10.8 | 5.42 | ||||||||||||||||
| Operating Profit Growth | % | ... | -223 | -1,028 | 39.9 | -26.3 | -69.3 | ||||||||||||||||
| Pre-Tax Profit Growth | % | ... | 2,393 | 204 | 48.1 | -51.1 | -84.7 | ||||||||||||||||
| Net Profit Growth | % | ... | 266 | 159 | 53.4 | -56.5 | -79.6 | ||||||||||||||||
| market share | |||||||||||||||||||||||
| Market Share in Revenues | % | 0.229 | 0.418 | 0.549 | 0.605 | 0.515 | |||||||||||||||||
| Market Share in Net Profit | % | 0.088 | 0.210 | 0.288 | 0.241 | 0.033 | |||||||||||||||||
| Market Share in Employees | % | ... | ... | ... | ... | ... | 0.537 | 0.697 | 0.878 | 0.948 | 1.06 | ||||||||||||
| Market Share in Branches | % | ... | ... | ... | ... | ... | 0.823 | 1.07 | 1.84 | 2.08 | 2.32 |
| balance sheet | Unit | 2002 | 2003 | 2004 | 2005 | 2006 | 2007 | 2008 | 2009 | 2010 | 2011 | 2012 | 2013 | 2014 | 2015 | 2016 | 2017 | 2018 | 2019 | 2020 | 2021 | 2022 | 2023 |
| balance sheet | |||||||||||||||||||||||
| Cash & Cash Equivalents | CZK mil | 752 | 1,027 | 1,477 | 1,082 | 920 | |||||||||||||||||
| Interbank Loans | CZK mil | 18,025 | 23,809 | 53,712 | 42,700 | 23,758 | |||||||||||||||||
| Customer Loans | CZK mil | 11,334 | 13,840 | 14,664 | 15,739 | 23,375 | |||||||||||||||||
| Retail Loans | CZK mil | ... | ... | ... | ... | ... | ... | ... | ... | ... | 188 | 256 | 211 | 670 | 4,367 | ||||||||
| Corporate Loans | CZK mil | ... | ... | ... | ... | ... | ... | ... | ... | ... | 11,344 | 13,872 | 14,773 | 15,489 | 19,448 | ||||||||
| Investments | CZK mil | 864 | 1,676 | 2,635 | 6,280 | 13,572 | |||||||||||||||||
| Property and Equipment | CZK mil | 125 | 353 | 469 | 405 | 766 | |||||||||||||||||
| Intangible Assets | CZK mil | ... | ... | ... | ... | ... | ... | ... | ... | ... | ... | ... | ... | ... | ... | ... | ... | ... | 224 | 242 | 239 | ||
| Goodwill | CZK mil | ... | ... | ... | ... | ... | ... | ... | ... | ... | ... | ... | ... | ... | ... | ... | ... | ... | ... | ... | 58.2 | ||
| Total Assets | CZK mil | 31,697 | 40,968 | 73,387 | 66,707 | 62,883 | |||||||||||||||||
| Shareholders' Equity | CZK mil | 2,243 | 3,411 | 4,424 | 4,538 | 4,562 | |||||||||||||||||
| Of Which Minority Interest | CZK mil | 0 | 0 | 0 | 0 | 0 | |||||||||||||||||
| Liabilities | CZK mil | 29,454 | 37,557 | 68,963 | 62,169 | 58,321 | |||||||||||||||||
| Interbank Borrowing | CZK mil | 4,007 | 2,405 | 0.600 | 45.6 | 369 | |||||||||||||||||
| Customer Deposits | CZK mil | 25,349 | 35,002 | 68,525 | 61,416 | 56,131 | |||||||||||||||||
| Sight Deposits | CZK mil | ... | ... | ... | ... | ... | ... | ... | ... | ... | ... | ... | ... | ... | ... | ... | ... | 10,142 | 18,272 | 7,520 | 8,521 | ||
| Term Deposits | CZK mil | ... | ... | ... | ... | ... | ... | ... | ... | ... | ... | ... | ... | ... | ... | ... | ... | 24,860 | 50,253 | 53,897 | 47,610 | ||
| Issued Debt Securities | CZK mil | 28.9 | 16.1 | 0 | 327 | 1,202 | |||||||||||||||||
| Subordinated Debt | CZK mil | ... | ... | ... | ... | ... | ... | ... | ... | ... | ... | ... | ... | ... | ... | ... | ... | ... | 0 | 327 | 1,202 | ||
| Other Liabilities | CZK mil | 69.4 | 134 | 438 | 380 | 618 | |||||||||||||||||
| asset quality | |||||||||||||||||||||||
| Non-Performing Loans | CZK mil | ... | ... | ... | ... | ... | 1,126 | 1,081 | 1,300 | 2,826 | 2,091 | ||||||||||||
| Gross Loans | CZK mil | ... | ... | ... | ... | ... | 11,532 | 14,128 | 14,984 | 16,159 | 23,815 | ||||||||||||
| Risk-Weighted Assets | CZK mil | ... | ... | ... | ... | ... | ... | ... | ... | ... | ... | ... | 16,189 | 18,639 | 21,104 | 22,160 | 26,856 | ||||||
| Total Provisions | CZK mil | ... | ... | ... | ... | ... | 198 | 287 | 320 | 420 | 441 | ||||||||||||
| growth rates | |||||||||||||||||||||||
| Customer Loan Growth | % | ... | 41.6 | 22.1 | 5.95 | 7.34 | 48.5 | ||||||||||||||||
| Retail Loan Growth | % | ... | ... | ... | ... | ... | ... | ... | ... | ... | ... | -28.4 | 36.1 | -17.7 | 218 | 552 | |||||||
| Corporate Loan Growth | % | ... | ... | ... | ... | ... | ... | ... | ... | ... | ... | 41.1 | 22.3 | 6.50 | 4.84 | 25.6 | |||||||
| Total Asset Growth | % | ... | 170 | 29.2 | 79.1 | -9.10 | -5.73 | ||||||||||||||||
| Shareholders' Equity Growth | % | ... | 45.0 | 52.1 | 29.7 | 2.58 | 0.529 | ||||||||||||||||
| Customer Deposit Growth | % | ... | 151 | 38.1 | 95.8 | -10.4 | -8.61 | ||||||||||||||||
| market share | |||||||||||||||||||||||
| Market Share in Customer Loans | % | 0.367 | 0.419 | 0.425 | 0.438 | 0.607 | ... | ||||||||||||||||
| Market Share in Corporate Loans | % | ... | ... | ... | ... | ... | ... | ... | ... | ... | 1.11 | 1.28 | 1.32 | 1.38 | 1.64 | ||||||||
| Market Share in Retail Loans | % | ... | ... | ... | ... | ... | ... | ... | ... | ... | 0.012 | 0.016 | 0.012 | 0.036 | 0.214 | ||||||||
| Market Share in Consumer Loans | % | ... | ... | ... | ... | ... | ... | ... | ... | ... | 0.012 | 0.016 | 0.012 | 0.036 | 0.214 | ... | ... | ||||||
| Market Share in Total Assets | % | 0.453 | 0.563 | 0.970 | 0.837 | 0.738 | |||||||||||||||||
| Market Share in Customer Deposits | % | 0.608 | 0.787 | 1.45 | 1.19 | 1.02 |
| ratios | Unit | 2002 | 2003 | 2004 | 2005 | 2006 | 2007 | 2008 | 2009 | 2010 | 2011 | 2012 | 2013 | 2014 | 2015 | 2016 | 2017 | 2018 | 2019 | 2020 | 2021 | 2022 | 2023 |
| ROE | % | ... | 3.49 | 6.06 | 6.71 | 2.55 | 0.512 | ||||||||||||||||
| ROTE | % | ... | ... | ... | ... | ... | ... | ... | ... | ... | ... | ... | ... | ... | ... | ... | ... | ... | ... | 2.69 | 0.541 | ||
| ROE (@ 15% of RWA) | % | ... | ... | ... | ... | ... | ... | ... | ... | ... | ... | ... | ... | 3.31 | 6.56 | 8.81 | 3.52 | 0.634 | |||||
| ROA | % | ... | 0.305 | 0.471 | 0.459 | 0.163 | 0.036 | ||||||||||||||||
| Return on Loans | % | 0.685 | 1.36 | 1.84 | 0.752 | 0.119 | |||||||||||||||||
| Operating Profit (As % of RWA) | % | ... | ... | ... | ... | ... | ... | ... | ... | ... | ... | ... | ... | -0.212 | 1.51 | 1.85 | 1.25 | 0.339 | |||||
| Costs (As % Of Assets) | % | ... | 2.02 | 1.47 | 1.30 | 1.17 | 1.34 | ||||||||||||||||
| Costs (As % Of Income) | % | 107 | 67.0 | 66.9 | 75.2 | 91.3 | |||||||||||||||||
| Costs (As % Of Loans) | % | ... | 4.54 | 4.24 | 5.20 | 5.40 | 4.43 | ||||||||||||||||
| Costs (As % Of Loans & Deposits) | % | ... | 1.60 | 1.25 | 1.12 | 1.02 | 1.11 | ||||||||||||||||
| Capital Adequacy Ratio | % | ... | ... | ... | ... | ... | 12.5 | 16.5 | 19.5 | 20.1 | 21.4 | ||||||||||||
| Tier 1 Ratio | % | ... | ... | ... | ... | ... | ... | ... | ... | ... | ... | ... | 12.5 | 16.5 | 19.5 | 18.7 | 17.2 | ||||||
| Net Interest Margin | % | ... | 1.56 | 2.13 | 1.81 | 1.29 | 1.45 | ||||||||||||||||
| Interest Spread | % | ... | 1.42 | 2.07 | 1.72 | 1.23 | 1.39 | ||||||||||||||||
| Asset Yield | % | ... | 3.02 | 2.91 | 3.11 | 2.26 | 2.22 | ||||||||||||||||
| Revenues (As % of RWA) | % | ... | ... | ... | ... | ... | ... | ... | ... | ... | ... | ... | ... | 3.07 | 4.57 | 5.58 | 5.05 | 3.87 | |||||
| Cost Of Liabilities | % | ... | 1.60 | 0.839 | 1.39 | 1.03 | 0.822 | ||||||||||||||||
| Interest Income (As % Of Revenues) | % | 82.4 | 97.4 | 93.3 | 82.8 | 99.2 | |||||||||||||||||
| Fee Income (As % Of Revenues) | % | -1.44 | -1.17 | 0.712 | 0.439 | 1.52 | |||||||||||||||||
| Other Income (As % Of Revenues) | % | 19.0 | 3.77 | 5.95 | 16.7 | -0.685 | |||||||||||||||||
| Staff Cost (As % Of Total Cost) | % | 36.1 | 35.6 | 35.4 | 33.7 | 40.2 | |||||||||||||||||
| Equity (As % Of Assets) | % | 7.08 | 8.33 | 6.03 | 6.80 | 7.25 | |||||||||||||||||
| Equity (As % Of Loans) | % | 19.8 | 24.6 | 30.2 | 28.8 | 19.5 | |||||||||||||||||
| Loans (As % Of Deposits) | % | 44.7 | 39.5 | 21.4 | 25.6 | 41.6 | |||||||||||||||||
| Loans (As % Assets) | % | 35.8 | 33.8 | 20.0 | 23.6 | 37.2 | |||||||||||||||||
| NPLs (As % Of Loans) | % | ... | ... | ... | ... | ... | 9.76 | 7.65 | 8.68 | 17.5 | 8.78 | ||||||||||||
| Provisions (As % Of NPLs) | % | ... | ... | ... | ... | ... | 17.6 | 26.6 | 24.6 | 14.8 | 21.1 | ||||||||||||
| Provisions (As % Of Loans) | % | ... | ... | ... | ... | ... | 1.75 | 2.07 | 2.18 | 2.67 | 1.88 | ||||||||||||
| Cost of Provisions (As % Of Loans) | % | ... | -1.07 | 0.281 | 0.217 | 0.699 | 0.304 |
| other data | Unit | 2002 | 2003 | 2004 | 2005 | 2006 | 2007 | 2008 | 2009 | 2010 | 2011 | 2012 | 2013 | 2014 | 2015 | 2016 | 2017 | 2018 | 2019 | 2020 | 2021 | 2022 | 2023 |
| Branches | ... | ... | ... | ... | ... | 16.0 | 21.0 | 35.0 | 35.0 | 37.0 | |||||||||||||
| Employees | ... | ... | ... | ... | ... | 225 | 292 | 365 | 386 | 421 | |||||||||||||
| Employees Per Bank Branch | ... | ... | ... | ... | ... | 14.1 | 13.9 | 10.4 | 11.0 | 11.4 | |||||||||||||
| Cost Per Employee | USD per month | ... | ... | ... | ... | ... | 2,500 | 2,477 | 2,661 | 2,717 | 3,177 | ||||||||||||
| Cost Per Employee (Local Currency) | CZK per month | ... | ... | ... | ... | ... | 58,667 | 54,195 | 59,977 | 59,780 | 68,844 |
| customer breakdown | Unit | 2002 | 2003 | 2004 | 2005 | 2006 | 2007 | 2008 | 2009 | 2010 | 2011 | 2012 | 2013 | 2014 | 2015 | 2016 | 2017 | 2018 | 2019 | 2020 | 2021 | 2022 | 2023 |
| Customers | mil | ... | ... | ... | ... | ... | 0.040 | 0.056 | 0.090 | 0.109 | 0.130 | ||||||||||||
| Revenue per Customer (Local Currency) | CZK | ... | ... | ... | ... | ... | 10,387 | 14,213 | 12,322 | 10,006 | 7,301 | ||||||||||||
| Net Profit per Customer (Local Currency) | CZK | ... | ... | ... | ... | ... | 1,676 | 3,059 | 2,919 | 1,047 | 179 | ||||||||||||
| Loan per Customer (Local Currency) | CZK | ... | ... | ... | ... | ... | 286,939 | 247,150 | 162,928 | 144,175 | 179,806 | ||||||||||||
| Deposit per Customer (Local Currency) | CZK | ... | ... | ... | ... | ... | 641,739 | 625,034 | 761,389 | 562,591 | 431,777 | ||||||||||||
| Revenue per Customer | USD | ... | ... | ... | ... | ... | 443 | 650 | 547 | 455 | 337 | ||||||||||||
| Net Profit per Customer | USD | ... | ... | ... | ... | ... | 71.4 | 140 | 129 | 47.6 | 8.27 | ||||||||||||
| Loan per Customer | USD | ... | ... | ... | ... | ... | 13,477 | 11,001 | 7,203 | 6,741 | 8,191 | ||||||||||||
| Deposit per Customer | USD | ... | ... | ... | ... | ... | 30,141 | 27,821 | 33,658 | 26,305 | 19,670 |
Get all company financials in excel:


By Helgi Library - May 8, 2024
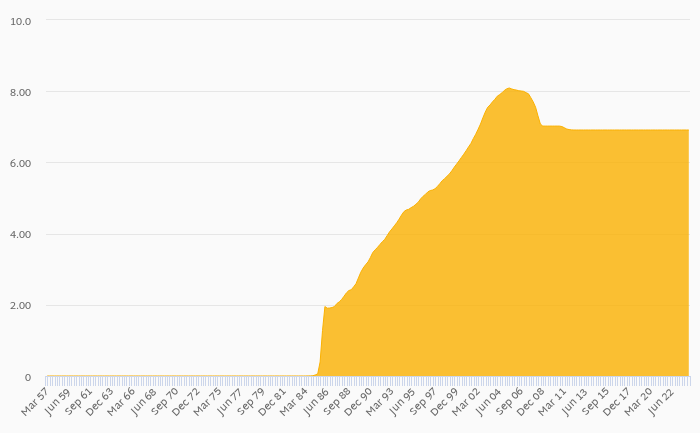
Banka Creditas's capital adequacy ratio reached 33.8% at the end of fourth quarter of 2023, up from 26.7% when compared to the previous quarter. Historically, the bank’s capital ratio hit an all time high of 33.8% in 4Q2023 and an all time low of 10.4% in 1Q2014. ...
By Helgi Library - May 8, 2024
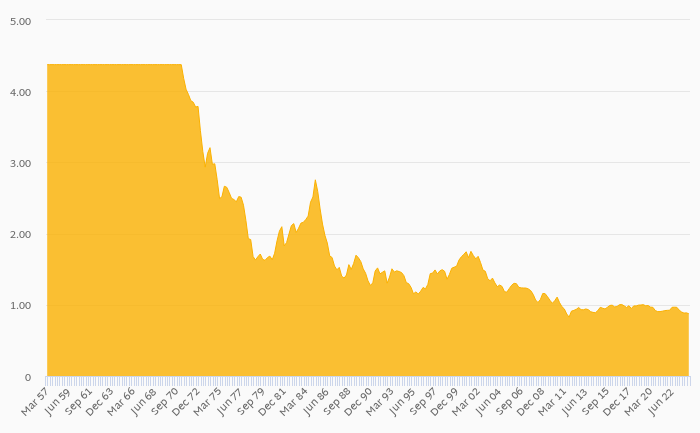
Banka Creditas's non-performing loans reached 2.74% of total loans at the end of 2023-12-31, down from 5.62% compared to the previous year. Historically, the NPL ratio hit an all time high of 36.9% in 2012-03-31 and an all time low of 1.40% in 2010-09-30. P...
By Helgi Library - May 8, 2024
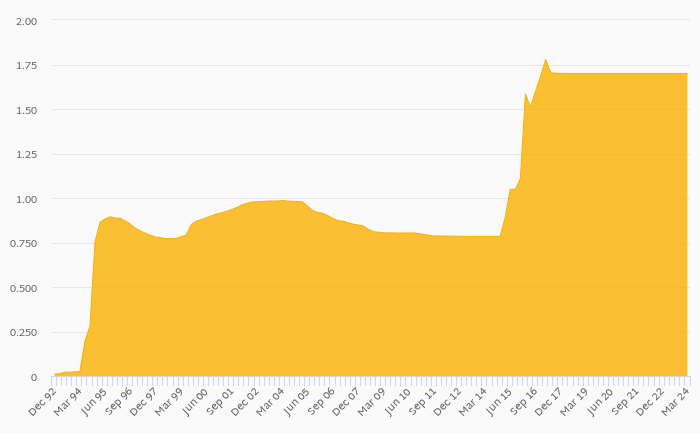
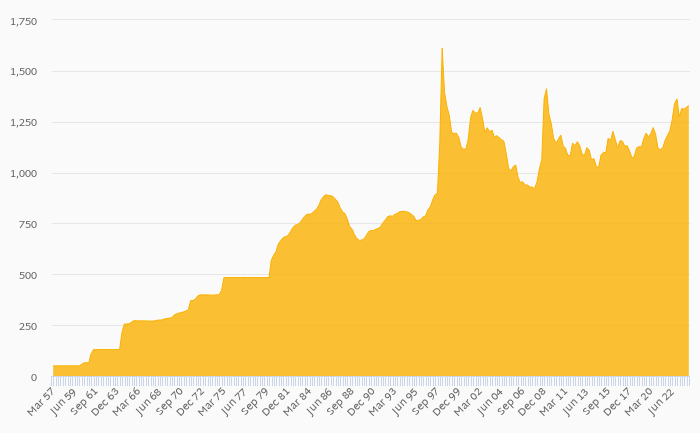
Banka Creditas's net interest margin amounted to 1.20% in the fourth quarter of 2023, down from 1.30% when compared to the previous quarter. Historically, the bank’s net interest margin reached an all time high of 8.18% in 4Q2011 and an all time low of ...
By Helgi Library - May 8, 2024
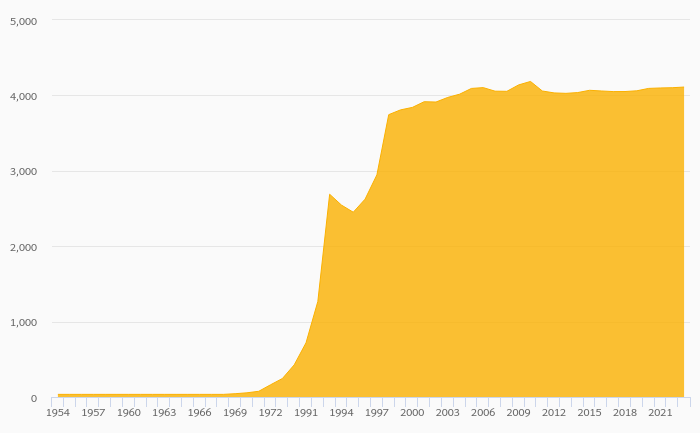
Banka Creditas employed 453 persons in 2023-12-31, up 0.667% when compared to the previous year. Historically, the bank's workforce hit an all time high of 470 persons in 2023-06-30 and an all time low of 10.0 in 2008-12-31. Average cost reached USD 4,618 per mont...
By Helgi Library - May 8, 2024
Banka Creditas's retail loans reached CZK 9,861 mil in the fourth quarter of 2023, down 10.4% compared to the previous year. Czech banking sector provided retail loans of CZK 2,242 bil in 4Q2023, up 0.906% when compared to the last year. Banka Creditas ac...
By Helgi Library - May 8, 2024
Banka Creditas made a net profit of CZK 232 mil in the fourth quarter of 2023, up 1% when compared to the same period of last year. This implies a return on equity of 10.1%. Historically, the bank’s net profit reached an all time high of CZK 1,450 mil in 3Q2022 a...
By Helgi Library - May 8, 2024
Banka Creditas made a net profit of CZK 232 mil under revenues of CZK 659 mil in the fourth quarter of 2023, up 1% and 50.2% respectively when compared to the same period last year. Historically, the bank’s net profit reached an all time high of CZK 1,450 mil...
By Helgi Library - May 8, 2024
Banka Creditas generated total banking revenues of CZK 659 mil in the fourth quarter of 2023, up 50.2% when compared to the same period of last year and 36.7% when compared to the previous quarter. Historically, the bank’s revenues containing of interest, ...
By Helgi Library - May 8, 2024
Banka Creditas's cost to income ratio reached 59.6% in the fourth quarter of 2023, down from 67.0% when compared to the previous quarter. Historically, the bank’s costs reached an all time high of 233% of income in 2Q2010 and an all time low of -1,085% in 3Q...
By Helgi Library - May 8, 2024
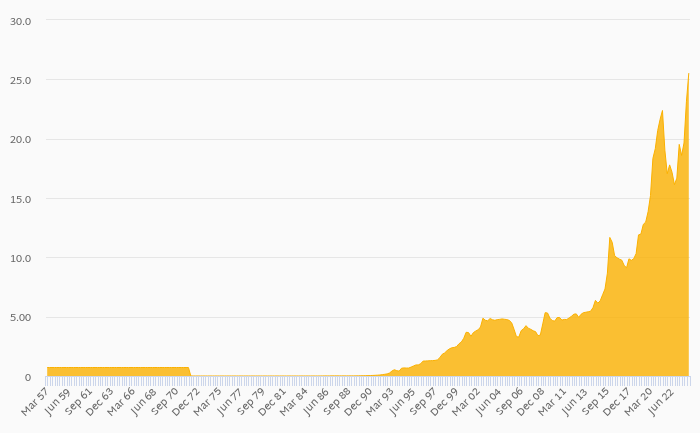
Banka Creditas's customer loan growth reached 27.8% in 2023-12-31, up from 8.73% compared to the previous year. Historically, the bank’s loans growth reached an all time high of 360% in 2011-03-31 and an all time low of -10.8% in 2015-06-30. In the last d...
Banka Creditas is a small-sized bank based in the Czech Republic. Before getting a banking license in 2016, Creditas operated as a savings institution Záložna Creditas, which was one of the largest credit unions in the country. From a small Company with regional operations, it transformed into the financial institution with nationwide operations. The Credit union is now Company with a branch network throughout the whole Czech Republic with a complete portfolio of products for both individuals and legal entities, including current accounts administration, savings, loan products, internet banking and MasterCard payment cards. It is member of the UNICAPITAL investment group.

Banka Creditas has been growing its revenues and asset by 21.7% and 34.7% a year on average in the last 10 years. Its loans and deposits have grown by 16.3% and 35.4% a year during that time and loans to deposits ratio reached 19.9% at the end of 2023. The company achieved an average return on equity of 6.61% in the last decade with net profit growing 152% a year on average. In terms of operating efficiency, its cost to income ratio reached 64.3% in 2023, compared to 78.9% average in the last decade.
Equity represented 5.36% of total assets or 29.4% of loans at the end of 2023. Banka Creditas's non-performing loans were 2.50% of total loans while provisions covered some 53.1% of NPLs at the end of 2023.
 Helgi Library