By Helgi Library - May 12, 2024
Fio banka made a net profit of CZK 1,754 mil under revenues of CZK 2,328 mil in the fourth quarter of 2023, up 37.6% and 19.8...
By Helgi Library - May 12, 2024
Fio banka made a net profit of CZK 1,754 mil in the fourth quarter of 2023, up 37.6% when compared to the same period of last yea...
By Helgi Library - May 12, 2024
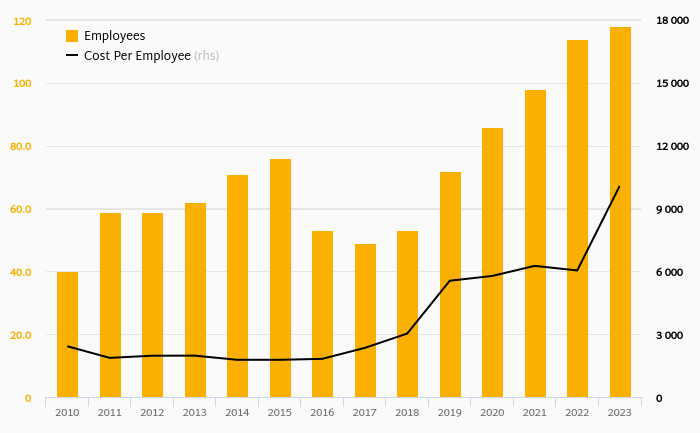
Fio banka employed 118 persons in 2023-12-31, down 0.840% when compared to the previous year. Historically, the bank's workforce...
| Profit Statement | 2021 | 2022 | 2023 | |
| Net Interest Income | CZK mil | 2,494 | 5,412 | 7,603 |
| Net Fee Income | CZK mil | 524 | 652 | 643 |
| Other Income | CZK mil | 769 | 699 | 770 |
| Total Revenues | CZK mil | 3,809 | 6,786 | 9,039 |
| Staff Cost | CZK mil | 160 | 184 | 321 |
| Operating Profit | CZK mil | 2,749 | 5,563 | 7,496 |
| Provisions | CZK mil | -111 | 423 | -5.65 |
| Net Profit | CZK mil | 2,338 | 4,406 | 6,478 |
| Balance Sheet | 2021 | 2022 | 2023 | |
| Interbank Loans | CZK mil | 2,289 | 3,190 | 2,507 |
| Customer Loans | CZK mil | 37,454 | 41,255 | 50,454 |
| Investments | CZK mil | 117,878 | 125,640 | 160,520 |
| Total Assets | CZK mil | 214,685 | 229,428 | 266,392 |
| Shareholders' Equity | CZK mil | 8,225 | 12,346 | 18,881 |
| Interbank Borrowing | CZK mil | 139 | 33.2 | 179 |
| Customer Deposits | CZK mil | 203,397 | 212,102 | 241,058 |
| Issued Debt Securities | CZK mil | 679 | 691 | 691 |
| Ratios | 2021 | 2022 | 2023 | |
| ROE | % | 33.8 | 42.8 | 41.5 |
| ROA | % | 1.18 | 1.98 | 2.61 |
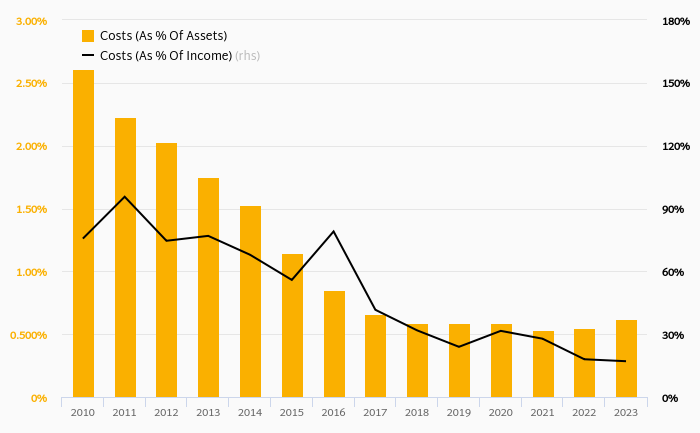
| Costs (As % Of Assets) | % | 0.534 | 0.551 | 0.623 |
| Costs (As % Of Income) | % | 27.8 | 18.0 | 17.1 |
| Capital Adequacy Ratio | % | 22.6 | 32.8 | 33.3 |
| Net Interest Margin | % | 1.26 | 2.44 | 3.07 |
| Loans (As % Of Deposits) | % | 18.4 | 19.5 | 20.9 |
| NPLs (As % Of Loans) | % | 9.47 | 9.21 | 9.58 |
| Provisions (As % Of NPLs) | % | 38.0 | 44.6 | 35.2 |
| Growth Rates | 2021 | 2022 | 2023 | |
| Total Revenue Growth | % | 24.3 | 78.1 | 33.2 |
| Operating Cost Growth | % | 9.61 | 15.3 | 26.2 |
| Operating Profit Growth | % | 31.1 | 102 | 34.7 |
| Net Profit Growth | % | 98.7 | 88.4 | 47.0 |
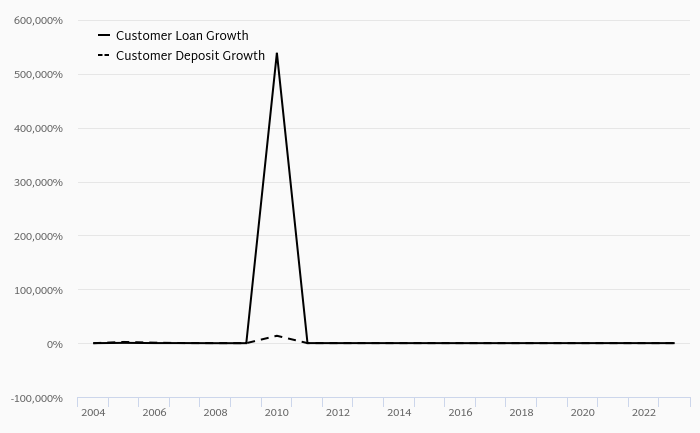
| Customer Loan Growth | % | 43.3 | 10.2 | 22.3 |
| Total Asset Growth | % | 17.6 | 6.87 | 16.1 |
| Customer Deposit Growth | % | 16.3 | 4.28 | 13.7 |
| Shareholders' Equity Growth | % | 46.8 | 50.1 | 52.9 |
| Employees | 98.0 | 114 | 118 | |
Get all company financials in excel:
| summary | Unit | 2003 | 2004 | 2005 | 2006 | 2007 | 2008 | 2009 | 2010 | 2011 | 2012 | 2013 | 2014 | 2015 | 2016 | 2017 | 2018 | 2019 | 2020 | 2021 | 2022 | 2023 |
| income statement | ||||||||||||||||||||||
| Net Interest Income | CZK mil | 561 | 1,303 | 2,398 | 2,007 | 2,494 | ||||||||||||||||
| Total Revenues | CZK mil | 1,493 | 2,155 | 3,328 | 3,064 | 3,809 | ||||||||||||||||
| Operating Profit | CZK mil | 871 | 1,470 | 2,531 | 2,096 | 2,749 | ||||||||||||||||
| Net Profit | CZK mil | 408 | 1,028 | 1,803 | 1,177 | 2,338 | ||||||||||||||||
| balance sheet | ||||||||||||||||||||||
| Interbank Loans | CZK mil | 2,064 | 1,810 | 2,097 | 1,915 | 2,289 | ||||||||||||||||
| Customer Loans | CZK mil | 13,147 | 15,134 | 20,148 | 26,145 | 37,454 | ||||||||||||||||
| Investments | CZK mil | 4,406 | 4,335 | 4,358 | 68,763 | 117,878 | ||||||||||||||||
| Total Assets | CZK mil | 107,574 | 124,500 | 146,770 | 182,537 | 214,685 | ||||||||||||||||
| Shareholders' Equity | CZK mil | 1,659 | 2,642 | 4,454 | 5,602 | 8,225 | ||||||||||||||||
| Interbank Borrowing | CZK mil | 173 | 237 | 233 | 224 | 139 | ||||||||||||||||
| Customer Deposits | CZK mil | 103,711 | 120,583 | 140,442 | 174,860 | 203,397 | ||||||||||||||||
| Issued Debt Securities | CZK mil | 90.0 | 90.0 | 90.0 | 90.0 | 679 | ||||||||||||||||
| ratios | ||||||||||||||||||||||
| ROE | % | ... | 28.1 | 47.8 | 50.8 | 23.4 | 33.8 | |||||||||||||||
| ROA | % | ... | 0.434 | 0.886 | 1.33 | 0.715 | 1.18 | |||||||||||||||
| Costs (As % Of Assets) | % | ... | 0.661 | 0.591 | 0.588 | 0.588 | 0.534 | |||||||||||||||
| Costs (As % Of Income) | % | 41.6 | 31.8 | 24.0 | 31.6 | 27.8 | ||||||||||||||||
| Capital Adequacy Ratio | % | ... | ... | ... | ... | ... | ... | ... | 12.5 | 15.3 | 18.2 | 21.1 | 22.6 | |||||||||
| Net Interest Margin | % | ... | 0.597 | 1.12 | 1.77 | 1.22 | 1.26 | |||||||||||||||
| Interest Income (As % Of Revenues) | % | 37.6 | 60.5 | 72.0 | 65.5 | 65.5 | ||||||||||||||||
| Fee Income (As % Of Revenues) | % | 23.9 | 14.8 | 11.3 | 14.1 | 13.8 | ||||||||||||||||
| Staff Cost (As % Of Total Cost) | % | 5.20 | 6.15 | 13.6 | 13.6 | 15.0 | ||||||||||||||||
| Equity (As % Of Assets) | % | 1.54 | 2.12 | 3.03 | 3.07 | 3.83 | ||||||||||||||||
| Loans (As % Of Deposits) | % | 12.7 | 12.6 | 14.3 | 15.0 | 18.4 | ||||||||||||||||
| Loans (As % Assets) | % | 12.2 | 12.2 | 13.7 | 14.3 | 17.4 | ||||||||||||||||
| NPLs (As % Of Loans) | % | ... | ... | ... | ... | ... | ... | ... | 7.92 | 5.59 | 10.8 | 13.6 | 9.47 | |||||||||
| Provisions (As % Of NPLs) | % | ... | ... | ... | ... | ... | ... | ... | ... | ... | 48.7 | 63.2 | 39.5 | 42.1 | 38.0 | |||||||
| valuation | ||||||||||||||||||||||
| Book Value Per Share Growth | % | ... | 30.2 | 132 | 84.0 | -16.3 | 24.3 |
| income statement | Unit | 2003 | 2004 | 2005 | 2006 | 2007 | 2008 | 2009 | 2010 | 2011 | 2012 | 2013 | 2014 | 2015 | 2016 | 2017 | 2018 | 2019 | 2020 | 2021 | 2022 | 2023 |
| income statement | ||||||||||||||||||||||
| Interest Income | CZK mil | 628 | 1,562 | 2,920 | 2,353 | 2,813 | ||||||||||||||||
| Interest Cost | CZK mil | 66.6 | 259 | 522 | 346 | 320 | ||||||||||||||||
| Net Interest Income | CZK mil | 561 | 1,303 | 2,398 | 2,007 | 2,494 | ||||||||||||||||
| Net Fee Income | CZK mil | 357 | 318 | 376 | 433 | 524 | ||||||||||||||||
| Fee Income | CZK mil | ... | ... | ... | ... | ... | ... | ... | ... | ... | ... | ... | ... | ... | ... | ... | ... | 603 | 705 | 800 | ||
| Fee Expense | CZK mil | ... | ... | ... | ... | ... | ... | ... | ... | ... | ... | ... | ... | ... | ... | ... | ... | 227 | 272 | 276 | ||
| Other Income | CZK mil | 575 | 534 | 555 | 602 | 769 | ||||||||||||||||
| Total Revenues | CZK mil | 1,493 | 2,155 | 3,328 | 3,064 | 3,809 | ||||||||||||||||
| Staff Cost | CZK mil | 32.3 | 42.1 | 108 | 131 | 160 | ||||||||||||||||
| Depreciation | CZK mil | 8.62 | 7.97 | 51.6 | 106 | 98.5 | ||||||||||||||||
| Other Cost | CZK mil | 581 | 635 | 638 | 731 | 802 | ||||||||||||||||
| Operating Cost | CZK mil | 622 | 685 | 797 | 967 | 1,060 | ||||||||||||||||
| Operating Profit | CZK mil | 871 | 1,470 | 2,531 | 2,096 | 2,749 | ||||||||||||||||
| Provisions | CZK mil | 393 | 217 | 306 | 636 | -111 | ||||||||||||||||
| Extra and Other Cost | CZK mil | -1.99 | -4.07 | -0.640 | -3.80 | 19.2 | ||||||||||||||||
| Pre-Tax Profit | CZK mil | 481 | 1,257 | 2,225 | 1,464 | 2,841 | ||||||||||||||||
| Tax | CZK mil | 72.7 | 229 | 422 | 287 | 503 | ||||||||||||||||
| Minorities | CZK mil | 0 | 0 | 0 | 0 | 0 | ||||||||||||||||
| Net Profit | CZK mil | 408 | 1,028 | 1,803 | 1,177 | 2,338 | ||||||||||||||||
| Net Profit Avail. to Common | CZK mil | 408 | 1,028 | 1,803 | 1,177 | 2,338 | ||||||||||||||||
| growth rates | ||||||||||||||||||||||
| Net Interest Income Growth | % | ... | 30.2 | 132 | 84.0 | -16.3 | 24.3 | |||||||||||||||
| Net Fee Income Growth | % | ... | 40.9 | -10.8 | 18.0 | 15.3 | 21.0 | |||||||||||||||
| Total Revenue Growth | % | ... | 101 | 44.4 | 54.4 | -7.95 | 24.3 | |||||||||||||||
| Operating Cost Growth | % | ... | 5.84 | 10.3 | 16.3 | 21.4 | 9.61 | |||||||||||||||
| Operating Profit Growth | % | ... | 460 | 68.7 | 72.2 | -17.2 | 31.1 | |||||||||||||||
| Pre-Tax Profit Growth | % | ... | 121 | 161 | 77.1 | -34.2 | 94.1 | |||||||||||||||
| Net Profit Growth | % | ... | 129 | 152 | 75.3 | -34.8 | 98.7 | |||||||||||||||
| market share | ||||||||||||||||||||||
| Market Share in Revenues | % | 0.833 | 1.13 | 1.65 | 1.70 | 2.07 | ||||||||||||||||
| Market Share in Net Profit | % | 0.542 | 1.26 | 1.98 | 2.48 | 3.32 | ||||||||||||||||
| Market Share in Employees | % | ... | ... | ... | ... | ... | 0.117 | 0.127 | 0.173 | 0.211 | 0.247 | |||||||||||
| Market Share in Branches | % | ... | ... | ... | ... | ... | ... | ... | 4.94 | 5.22 | 5.48 | 6.31 | 6.89 |
| balance sheet | Unit | 2003 | 2004 | 2005 | 2006 | 2007 | 2008 | 2009 | 2010 | 2011 | 2012 | 2013 | 2014 | 2015 | 2016 | 2017 | 2018 | 2019 | 2020 | 2021 | 2022 | 2023 |
| balance sheet | ||||||||||||||||||||||
| Cash & Cash Equivalents | CZK mil | 86,780 | 101,908 | 118,148 | 81,087 | 55,054 | ||||||||||||||||
| Interbank Loans | CZK mil | 2,064 | 1,810 | 2,097 | 1,915 | 2,289 | ||||||||||||||||
| Customer Loans | CZK mil | 13,147 | 15,134 | 20,148 | 26,145 | 37,454 | ||||||||||||||||
| Retail Loans | CZK mil | ... | ... | ... | ... | ... | ... | ... | 5,370 | 5,198 | 7,161 | 9,766 | 15,980 | |||||||||
| Corporate Loans | CZK mil | ... | ... | ... | ... | ... | ... | ... | 7,776 | 9,936 | 12,988 | 16,379 | 21,474 | |||||||||
| Investments | CZK mil | 4,406 | 4,335 | 4,358 | 68,763 | 117,878 | ||||||||||||||||
| Property and Equipment | CZK mil | 17.4 | 14.5 | 244 | 500 | 355 | ||||||||||||||||
| Intangible Assets | CZK mil | ... | ... | ... | ... | ... | ... | ... | ... | ... | ... | ... | ... | ... | ... | ... | ... | 4.20 | 2.72 | 3.23 | ||
| Total Assets | CZK mil | 107,574 | 124,500 | 146,770 | 182,537 | 214,685 | ||||||||||||||||
| Shareholders' Equity | CZK mil | 1,659 | 2,642 | 4,454 | 5,602 | 8,225 | ||||||||||||||||
| Of Which Minority Interest | CZK mil | 0 | 0 | 0 | 0 | 0 | ||||||||||||||||
| Liabilities | CZK mil | 105,915 | 121,857 | 142,317 | 176,935 | 206,460 | ||||||||||||||||
| Interbank Borrowing | CZK mil | 173 | 237 | 233 | 224 | 139 | ||||||||||||||||
| Customer Deposits | CZK mil | 103,711 | 120,583 | 140,442 | 174,860 | 203,397 | ||||||||||||||||
| Sight Deposits | CZK mil | ... | ... | ... | ... | ... | ... | ... | ... | ... | ... | ... | 99,697 | 116,504 | 136,106 | 171,286 | 200,195 | |||||
| Term Deposits | CZK mil | ... | ... | ... | ... | ... | ... | ... | ... | ... | ... | ... | 4,014 | 4,080 | 4,336 | 3,574 | 3,202 | |||||
| Issued Debt Securities | CZK mil | 90.0 | 90.0 | 90.0 | 90.0 | 679 | ||||||||||||||||
| Subordinated Debt | CZK mil | ... | ... | ... | ... | ... | ... | ... | ... | ... | ... | ... | ... | ... | ... | ... | ... | ... | ... | 90.0 | ||
| Other Liabilities | CZK mil | 1,941 | 948 | 1,551 | 1,761 | 2,246 | ||||||||||||||||
| asset quality | ||||||||||||||||||||||
| Non-Performing Loans | CZK mil | ... | ... | ... | ... | ... | ... | ... | 1,083 | 878 | 2,176 | 3,555 | 3,545 | |||||||||
| Gross Loans | CZK mil | ... | ... | ... | ... | ... | ... | ... | 13,674 | 15,688 | 20,148 | 26,145 | 37,454 | |||||||||
| Risk-Weighted Assets | CZK mil | ... | ... | ... | ... | ... | ... | ... | ... | ... | ... | 13,377 | 17,133 | 23,797 | 24,450 | 33,137 | ||||||
| Total Provisions | CZK mil | ... | ... | ... | ... | ... | ... | ... | 527 | 555 | 861 | 1,497 | 1,346 | |||||||||
| growth rates | ||||||||||||||||||||||
| Customer Loan Growth | % | ... | -4.74 | 15.1 | 33.1 | 29.8 | 43.3 | |||||||||||||||
| Retail Loan Growth | % | ... | ... | ... | ... | ... | ... | ... | ... | 20.3 | -3.22 | 37.8 | 36.4 | 63.6 | ||||||||
| Corporate Loan Growth | % | ... | ... | ... | ... | ... | ... | ... | ... | -16.7 | 27.8 | 30.7 | 26.1 | 31.1 | ||||||||
| Total Asset Growth | % | ... | 33.7 | 15.7 | 17.9 | 24.4 | 17.6 | |||||||||||||||
| Shareholders' Equity Growth | % | ... | 32.6 | 59.3 | 68.6 | 25.8 | 46.8 | |||||||||||||||
| Customer Deposit Growth | % | ... | 33.2 | 16.3 | 16.5 | 24.5 | 16.3 | |||||||||||||||
| market share | ||||||||||||||||||||||
| Market Share in Customer Loans | % | 0.426 | 0.458 | 0.584 | 0.727 | 0.973 | ... | |||||||||||||||
| Market Share in Corporate Loans | % | ... | ... | ... | ... | ... | ... | ... | 0.761 | 0.920 | 1.16 | 1.46 | 1.81 | |||||||||
| Market Share in Retail Loans | % | ... | ... | ... | ... | ... | ... | ... | 0.352 | 0.316 | 0.410 | 0.525 | 0.782 | |||||||||
| Market Share in Consumer Loans | % | ... | ... | ... | ... | ... | ... | ... | 0.351 | 0.316 | 0.410 | 0.525 | 0.782 | ... | ... | |||||||
| Market Share in Total Assets | % | 1.54 | 1.71 | 1.94 | 2.29 | 2.52 | ||||||||||||||||
| Market Share in Customer Deposits | % | 2.49 | 2.71 | 2.96 | 3.39 | 3.70 |
| ratios | Unit | 2003 | 2004 | 2005 | 2006 | 2007 | 2008 | 2009 | 2010 | 2011 | 2012 | 2013 | 2014 | 2015 | 2016 | 2017 | 2018 | 2019 | 2020 | 2021 | 2022 | 2023 |
| ROE | % | ... | 28.1 | 47.8 | 50.8 | 23.4 | 33.8 | |||||||||||||||
| ROTE | % | ... | ... | ... | ... | ... | ... | ... | ... | ... | ... | ... | ... | ... | ... | ... | ... | ... | 23.4 | 33.8 | ||
| ROE (@ 15% of RWA) | % | ... | ... | ... | ... | ... | ... | ... | ... | ... | ... | ... | 21.9 | 44.9 | 58.7 | 32.5 | 54.1 | |||||
| ROA | % | ... | 0.434 | 0.886 | 1.33 | 0.715 | 1.18 | |||||||||||||||
| Return on Loans | % | 3.03 | 7.27 | 10.2 | 5.08 | 7.35 | ||||||||||||||||
| Operating Profit (As % of RWA) | % | ... | ... | ... | ... | ... | ... | ... | ... | ... | ... | ... | 7.00 | 9.64 | 12.4 | 8.69 | 9.55 | |||||
| Costs (As % Of Assets) | % | ... | 0.661 | 0.591 | 0.588 | 0.588 | 0.534 | |||||||||||||||
| Costs (As % Of Income) | % | 41.6 | 31.8 | 24.0 | 31.6 | 27.8 | ||||||||||||||||
| Costs (As % Of Loans) | % | ... | 4.61 | 4.85 | 4.52 | 4.18 | 3.33 | |||||||||||||||
| Costs (As % Of Loans & Deposits) | % | ... | 0.596 | 0.543 | 0.538 | 0.535 | 0.480 | |||||||||||||||
| Capital Adequacy Ratio | % | ... | ... | ... | ... | ... | ... | ... | 12.5 | 15.3 | 18.2 | 21.1 | 22.6 | |||||||||
| Tier 1 Ratio | % | ... | ... | ... | ... | ... | ... | ... | ... | ... | ... | 11.8 | 14.7 | 17.8 | 20.7 | 22.3 | ||||||
| Net Interest Margin | % | ... | 0.597 | 1.12 | 1.77 | 1.22 | 1.26 | |||||||||||||||
| Interest Spread | % | ... | 0.596 | 1.12 | 1.76 | 1.21 | 1.25 | |||||||||||||||
| Asset Yield | % | ... | 0.668 | 1.35 | 2.15 | 1.43 | 1.42 | |||||||||||||||
| Revenues (As % of RWA) | % | ... | ... | ... | ... | ... | ... | ... | ... | ... | ... | ... | 12.0 | 14.1 | 16.3 | 12.7 | 13.2 | |||||
| Cost Of Liabilities | % | ... | 0.072 | 0.228 | 0.395 | 0.217 | 0.167 | |||||||||||||||
| Interest Income (As % Of Revenues) | % | 37.6 | 60.5 | 72.0 | 65.5 | 65.5 | ||||||||||||||||
| Fee Income (As % Of Revenues) | % | 23.9 | 14.8 | 11.3 | 14.1 | 13.8 | ||||||||||||||||
| Other Income (As % Of Revenues) | % | 38.5 | 24.8 | 16.7 | 19.6 | 20.2 | ||||||||||||||||
| Staff Cost (As % Of Total Cost) | % | 5.20 | 6.15 | 13.6 | 13.6 | 15.0 | ||||||||||||||||
| Equity (As % Of Assets) | % | 1.54 | 2.12 | 3.03 | 3.07 | 3.83 | ||||||||||||||||
| Equity (As % Of Loans) | % | 12.6 | 17.5 | 22.1 | 21.4 | 22.0 | ||||||||||||||||
| Loans (As % Of Deposits) | % | 12.7 | 12.6 | 14.3 | 15.0 | 18.4 | ||||||||||||||||
| Loans (As % Assets) | % | 12.2 | 12.2 | 13.7 | 14.3 | 17.4 | ||||||||||||||||
| NPLs (As % Of Loans) | % | ... | ... | ... | ... | ... | ... | ... | 7.92 | 5.59 | 10.8 | 13.6 | 9.47 | |||||||||
| Provisions (As % Of NPLs) | % | ... | ... | ... | ... | ... | ... | ... | ... | ... | 48.7 | 63.2 | 39.5 | 42.1 | 38.0 | |||||||
| Provisions (As % Of Loans) | % | ... | ... | ... | ... | ... | ... | ... | 4.01 | 3.67 | 4.27 | 5.72 | 3.59 | |||||||||
| Cost of Provisions (As % Of Loans) | % | ... | 2.91 | 1.54 | 1.74 | 2.75 | -0.349 |
| other data | Unit | 2003 | 2004 | 2005 | 2006 | 2007 | 2008 | 2009 | 2010 | 2011 | 2012 | 2013 | 2014 | 2015 | 2016 | 2017 | 2018 | 2019 | 2020 | 2021 | 2022 | 2023 |
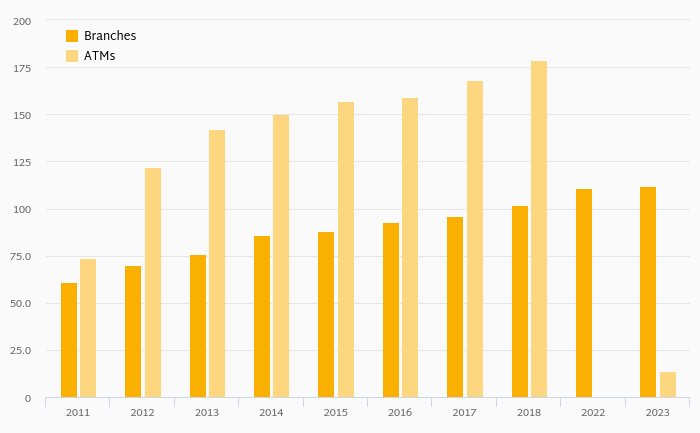
| Branches | ... | ... | ... | ... | ... | ... | ... | 96.0 | 102 | 104 | 106 | 110 | ||||||||||
| ATMs | ... | ... | ... | ... | ... | ... | ... | ... | 168 | 179 | ... | ... | ... | |||||||||
| ATMs (As % of Bank Branches) | % | ... | ... | ... | ... | ... | ... | ... | ... | 175 | 175 | ... | ... | ... | ||||||||
| Employees | ... | ... | ... | ... | ... | 49.0 | 53.0 | 72.0 | 86.0 | 98.0 | ||||||||||||
| Employees Per Bank Branch | ... | ... | ... | ... | ... | ... | ... | 0.510 | 0.520 | 0.692 | 0.811 | 0.891 | ||||||||||
| Cost Per Employee | USD per month | ... | ... | ... | ... | ... | 2,343 | 3,029 | 5,551 | 5,780 | 6,260 | |||||||||||
| Cost Per Employee (Local Currency) | CZK per month | ... | ... | ... | ... | ... | 54,988 | 66,272 | 125,131 | 127,172 | 135,658 |
| customer breakdown | Unit | 2003 | 2004 | 2005 | 2006 | 2007 | 2008 | 2009 | 2010 | 2011 | 2012 | 2013 | 2014 | 2015 | 2016 | 2017 | 2018 | 2019 | 2020 | 2021 | 2022 | 2023 |
| Customers | mil | 0.785 | 0.900 | 0.950 | 1.05 | 1.10 | ||||||||||||||||
| Average Size of Mortgage Loan | CZK | ... | ... | ... | ... | ... | ... | ... | ... | ... | ... | 1,393,000 | 1,451,000 | 1,444,000 | 1,444,000 | ... | ... | ... | ||||
| Revenue per Customer (Local Currency) | CZK | 1,902 | 2,395 | 3,503 | 2,918 | 3,463 | ||||||||||||||||
| Net Profit per Customer (Local Currency) | CZK | 520 | 1,143 | 1,898 | 1,120 | 2,125 | ||||||||||||||||
| Loan per Customer (Local Currency) | CZK | 16,748 | 16,815 | 21,209 | 24,900 | 34,049 | ||||||||||||||||
| Deposit per Customer (Local Currency) | CZK | 132,116 | 133,981 | 147,834 | 166,534 | 184,906 | ||||||||||||||||
| Revenue per Customer | USD | 81.1 | 109 | 155 | 133 | 160 | ||||||||||||||||
| Net Profit per Customer | USD | 22.2 | 52.2 | 84.2 | 50.9 | 98.1 | ||||||||||||||||
| Loan per Customer | USD | 787 | 748 | 938 | 1,164 | 1,551 | ||||||||||||||||
| Deposit per Customer | USD | 6,205 | 5,964 | 6,535 | 7,787 | 8,424 |
Get all company financials in excel:
By Helgi Library - May 12, 2024
Fio banka's customer loans reached CZK 48,755 mil in 2023-09-30, up 5.40% compared to the previous year. Czech banking sector provided customer loans of CZK 4,290 bil in 2023-09-30, up 1.99% when compared to the last year. Fio banka accounted for 1.14% of...
By Helgi Library - May 12, 2024
Fio banka generated total banking revenues of CZK 2,328 mil in 2023-12-31, up 1.53% compared to the previous year. Czech banking sector banking sector generated total revenues of CZK 58,954 mil in 2023-12-31, up 3.14% when compared to the last year. ...
By Helgi Library - May 12, 2024
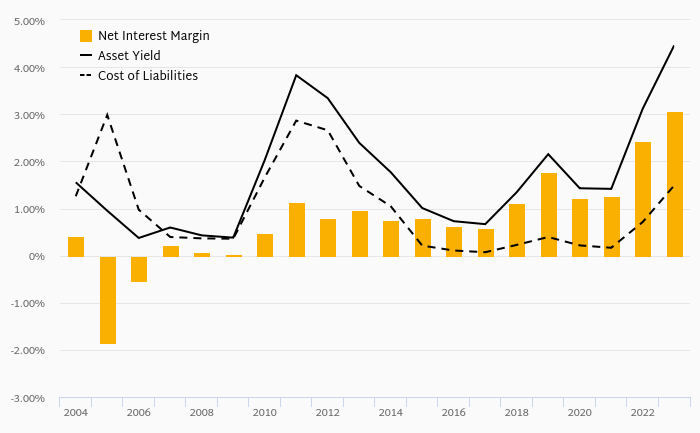
Fio banka's net interest margin amounted to 2.98% in the fourth quarter of 2023, down from 3.13% when compared to the previous quarter. Historically, the bank’s net interest margin reached an all time high of 3.29% in 2Q2023 and an all time low of 0.263...
By Helgi Library - May 12, 2024
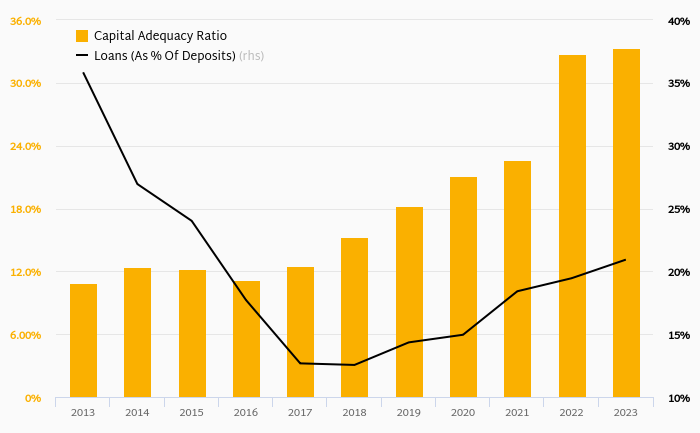
Fio banka's capital adequacy ratio reached 33.3% at the end of fourth quarter of 2023, down from 35.8% when compared to the previous quarter. Historically, the bank’s capital ratio hit an all time high of 35.8% in 3Q2023 and an all time low of 10.4% in 2Q2014. ...
By Helgi Library - May 12, 2024
Fio banka's customer deposits reached CZK 241,058 mil in 2023-12-31, up 4.27% compared to the previous year. Czech banking sector accepted customer deposits of CZK 6,701 bil in 2023-12-31, down 3.35% when compared to the last year. Fio banka accounted for...
By Helgi Library - May 12, 2024
Fio banka's retail loans reached CZK 21,094 mil in the fourth quarter of 2023, up 3.10% compared to the previous year. Czech banking sector provided retail loans of CZK 2,242 bil in 4Q2023, up 0.906% when compared to the last year. Fio banka accounted for...
By Helgi Library - May 12, 2024
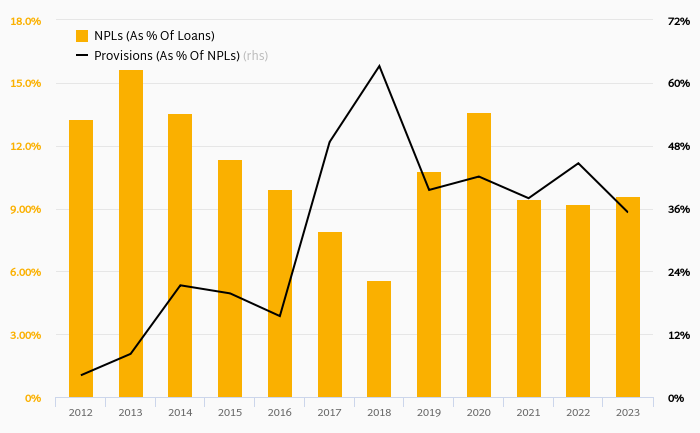
Fio banka's non-performing loans reached 9.58% of total loans at the end of 2023-12-31, up from 9.21% compared to the previous year. Historically, the NPL ratio hit an all time high of 20.4% in 2013-09-30 and an all time low of 4.21% in 2018-09-30. Provisio...
By Helgi Library - May 12, 2024
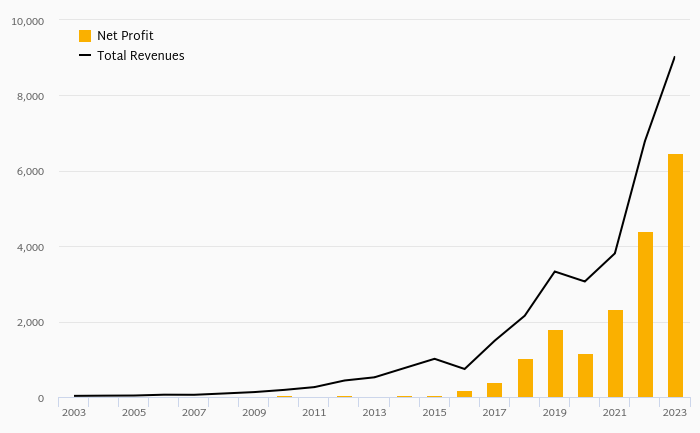
Fio banka generated total banking revenues of CZK 2,328 mil in the fourth quarter of 2023, up 19.8% when compared to the same period of last year and 1.53% when compared to the previous quarter. Historically, the bank’s revenues containing of interest, fe...
By Helgi Library - May 12, 2024
Fio banka's Equity reached 7.09% of total assets in the 4Q2023, up from 5.38% for the previous year. As a share of net customer loans, the ratio amounted to 37.4% at the end of the fourth quarter of 2023. ...
By Helgi Library - May 12, 2024
Fio banka's cost to income ratio reached 22.1% in the fourth quarter of 2023, up from 15.5% when compared to the previous quarter. Historically, the bank’s costs reached an all time high of 2,685% of income in 4Q2011 and an all time low of 14.4% in 1Q2023. ...
Fio banka is a young Czech bank established only in 2008. But, the history of Fio dates back to 1993 when a group of students established a securities broker. Since then, Fio has expanded both geographically (as it entered a number of stock exchanges in the Central Europe and elsewehere) as well as business-wise (with a credit union started in 1996). The expansion has been crowned by a an acquisition of RM-System, Czech Republic's off-market securities exchange. Nowadays, the bank already services more than 900,000 clients through a network of 80 branches occuppying around 1% of the Czech banking market by assets (2018 figures).

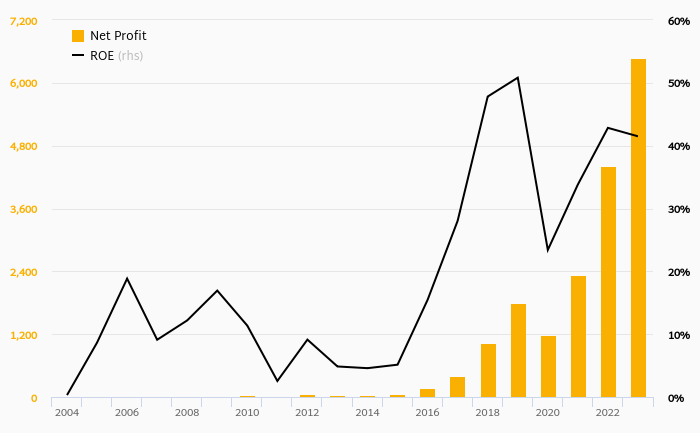
Fio banka has been growing its revenues and asset by 33.0% and 25.6% a year on average in the last 10 years. Its loans and deposits have grown by 18.5% and 25.1% a year during that time and loans to deposits ratio reached 20.9% at the end of 2023. The company achieved an average return on equity of 29.3% in the last decade with net profit growing 68.0% a year on average. In terms of operating efficiency, its cost to income ratio reached 17.1% in 2023, compared to 39.5% average in the last decade.
Equity represented 7.09% of total assets or 37.4% of loans at the end of 2023. Fio banka's non-performing loans were 9.58% of total loans while provisions covered some 35.2% of NPLs at the end of 2023.
 Helgi Library