By Helgi Library - May 11, 2024
Raiffeisenbank Czech Republic's mortgage loans reached CZK 133,242 mil in 4Q2023, up 2.76% compared to the previous year. Czech...
By Helgi Library - May 11, 2024
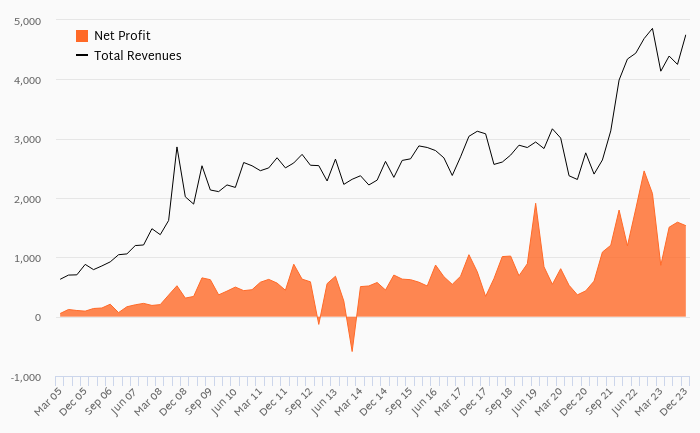
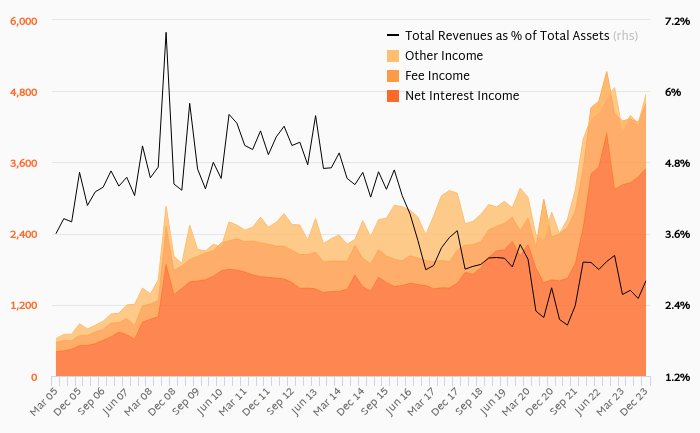
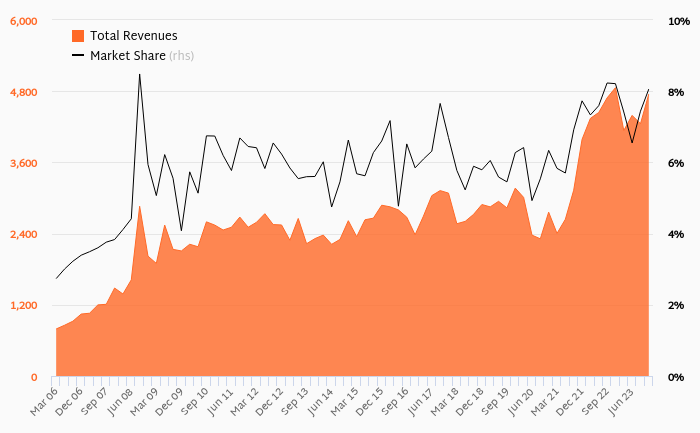
Raiffeisenbank Czech Republic generated total banking revenues of CZK 4,752 mil in 2023-12-31, up 11.8% compared to the previous...
By Helgi Library - May 11, 2024
Raiffeisenbank Czech Republic's customer deposits reached CZK 538,857 mil in 2023-12-31, down 0.766% compared to the previous year. ...
| Profit Statement | 2021 | 2022 | 2023 | |
| Net Interest Income | CZK mil | 10,156 | 15,758 | 15,409 |
| Net Fee Income | CZK mil | 3,961 | 4,994 | 4,677 |
| Other Income | CZK mil | -233 | -20.0 | 426 |
| Total Revenues | CZK mil | 13,884 | 20,732 | 20,512 |
| Staff Cost | CZK mil | 4,131 | 4,399 | 4,476 |
| Operating Profit | CZK mil | 5,344 | 10,593 | 10,804 |
| Provisions | CZK mil | 0 | -145 | 975 |
| Net Profit | CZK mil | 4,770 | 8,804 | 7,494 |
| Balance Sheet | 2021 | 2022 | 2023 | |
| Interbank Loans | CZK mil | 197,963 | 160,048 | 152,950 |
| Customer Loans | CZK mil | 371,751 | 412,736 | 429,589 |
| Investments | CZK mil | 41,150 | 51,617 | 99,719 |
| Total Assets | CZK mil | 651,008 | 666,382 | 739,750 |
| Shareholders' Equity | CZK mil | 45,925 | 54,145 | 58,694 |
| Interbank Borrowing | CZK mil | 13,107 | 10,669 | 23,719 |
| Customer Deposits | CZK mil | 553,090 | 550,061 | 593,995 |
| Issued Debt Securities | CZK mil | 25,510 | 29,715 | 41,544 |
| Ratios | 2021 | 2022 | 2023 | |
| ROE | % | 11.5 | 17.6 | 13.3 |
| ROA | % | 0.842 | 1.34 | 1.07 |
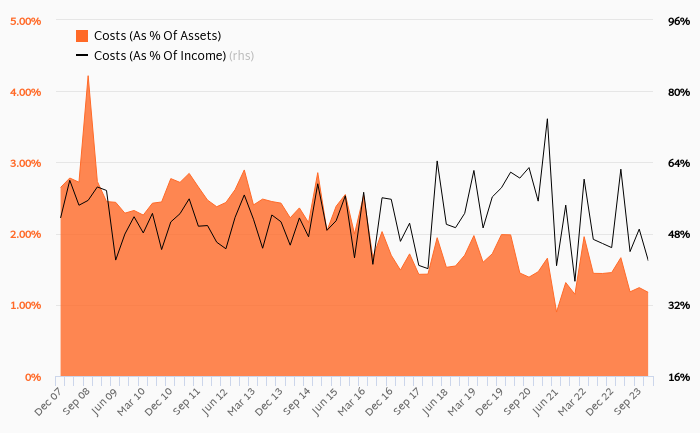
| Costs (As % Of Assets) | % | 1.51 | 1.54 | 1.38 |
| Costs (As % Of Income) | % | 61.5 | 48.9 | 47.3 |
| Capital Adequacy Ratio | % | 26.1 | 21.0 | 24.0 |
| Net Interest Margin | % | 1.79 | 2.39 | 2.19 |
| Loans (As % Of Deposits) | % | 67.2 | 75.0 | 72.3 |
| NPLs (As % Of Loans) | % | 1.80 | 1.39 | 1.47 |
| Provisions (As % Of NPLs) | % | 81.0 | 90.1 | 88.2 |
| Growth Rates | 2021 | 2022 | 2023 | |
| Total Revenue Growth | % | 52.7 | 49.3 | -1.06 |
| Operating Cost Growth | % | 24.1 | 18.7 | -4.25 |
| Operating Profit Growth | % | 142 | 98.2 | 1.99 |
| Net Profit Growth | % | 114 | 84.6 | -14.9 |
| Customer Loan Growth | % | 49.2 | 11.0 | 4.08 |
| Total Asset Growth | % | 35.1 | 2.36 | 11.0 |
| Customer Deposit Growth | % | 37.3 | -0.548 | 7.99 |
| Shareholders' Equity Growth | % | 24.7 | 17.9 | 8.40 |
| Employees | 3,801 | 3,358 | 3,208 | |
Get all company financials in excel:
| summary | Unit | 2004 | 2005 | 2006 | 2007 | 2008 | 2009 | 2010 | 2011 | 2012 | 2013 | 2014 | 2015 | 2016 | 2017 | 2018 | 2019 | 2020 | 2021 | 2022 | 2023 |
| income statement | |||||||||||||||||||||
| Net Interest Income | CZK mil | 6,564 | 7,665 | 9,047 | 7,849 | 10,156 | |||||||||||||||
| Total Revenues | CZK mil | 11,338 | 11,872 | 11,874 | 9,090 | 13,884 | |||||||||||||||
| Operating Profit | CZK mil | 4,860 | 5,551 | 4,666 | 2,209 | 5,344 | |||||||||||||||
| Net Profit | CZK mil | 3,084 | 3,815 | 4,731 | 2,224 | 4,770 | |||||||||||||||
| balance sheet | |||||||||||||||||||||
| Interbank Loans | CZK mil | 103,588 | 99,528 | 87,242 | 107,619 | 197,963 | |||||||||||||||
| Customer Loans | CZK mil | 218,987 | 236,604 | 246,644 | 249,083 | 371,751 | |||||||||||||||
| Investments | CZK mil | 1,067 | 10,785 | 4,777 | 43,237 | 41,150 | |||||||||||||||
| Total Assets | CZK mil | 342,699 | 366,158 | 370,715 | 482,000 | 651,008 | |||||||||||||||
| Shareholders' Equity | CZK mil | 27,905 | 29,900 | 32,703 | 36,814 | 45,925 | |||||||||||||||
| Interbank Borrowing | CZK mil | 31,372 | 34,402 | 21,961 | 12,201 | 13,107 | |||||||||||||||
| Customer Deposits | CZK mil | 251,732 | 270,921 | 290,691 | 402,776 | 553,090 | |||||||||||||||
| Issued Debt Securities | CZK mil | 22,186 | 22,177 | 16,001 | 17,614 | 25,510 | |||||||||||||||
| ratios | |||||||||||||||||||||
| ROE | % | ... | 11.6 | 13.2 | 15.1 | 6.40 | 11.5 | ||||||||||||||
| ROA | % | ... | 0.933 | 1.08 | 1.28 | 0.522 | 0.842 | ||||||||||||||
| Costs (As % Of Assets) | % | ... | 1.96 | 1.78 | 1.96 | 1.61 | 1.51 | ||||||||||||||
| Costs (As % Of Income) | % | 57.1 | 53.2 | 60.7 | 75.7 | 61.5 | |||||||||||||||
| Capital Adequacy Ratio | % | 17.7 | 16.9 | 18.7 | 22.8 | 26.1 | |||||||||||||||
| Net Interest Margin | % | ... | 1.99 | 2.16 | 2.46 | 1.84 | 1.79 | ||||||||||||||
| Interest Income (As % Of Revenues) | % | 57.9 | 64.6 | 76.2 | 86.3 | 73.1 | |||||||||||||||
| Fee Income (As % Of Revenues) | % | 17.7 | 16.7 | 28.0 | 34.3 | 28.5 | |||||||||||||||
| Staff Cost (As % Of Total Cost) | % | 50.9 | 51.4 | 49.5 | 49.4 | 48.4 | |||||||||||||||
| Equity (As % Of Assets) | % | 8.14 | 8.17 | 8.82 | 7.64 | 7.05 | |||||||||||||||
| Loans (As % Of Deposits) | % | 87.0 | 87.3 | 84.8 | 61.8 | 67.2 | |||||||||||||||
| Loans (As % Assets) | % | 63.9 | 64.6 | 66.5 | 51.7 | 57.1 | |||||||||||||||
| NPLs (As % Of Loans) | % | 2.46 | 1.91 | 1.97 | 2.30 | 1.80 | |||||||||||||||
| Provisions (As % Of NPLs) | % | 91.7 | 96.9 | 75.9 | 84.6 | 81.0 | |||||||||||||||
| valuation | |||||||||||||||||||||
| Book Value Per Share Growth | % | ... | 4.42 | 16.8 | 18.0 | -13.2 | 29.4 |
| income statement | Unit | 2004 | 2005 | 2006 | 2007 | 2008 | 2009 | 2010 | 2011 | 2012 | 2013 | 2014 | 2015 | 2016 | 2017 | 2018 | 2019 | 2020 | 2021 | 2022 | 2023 |
| income statement | |||||||||||||||||||||
| Interest Income | CZK mil | 9,417 | 12,121 | 16,083 | 10,396 | 12,666 | |||||||||||||||
| Interest Cost | CZK mil | 2,853 | 4,456 | 7,036 | 2,547 | 2,510 | |||||||||||||||
| Net Interest Income | CZK mil | 6,564 | 7,665 | 9,047 | 7,849 | 10,156 | |||||||||||||||
| Net Fee Income | CZK mil | 2,004 | 1,980 | 3,321 | 3,114 | 3,961 | |||||||||||||||
| Fee Income | CZK mil | ... | ... | ... | ... | ... | ... | ... | ... | ... | ... | ... | ... | ... | ... | ... | 4,313 | 4,042 | 5,145 | ||
| Fee Expense | CZK mil | ... | ... | ... | ... | ... | ... | ... | ... | ... | ... | ... | ... | ... | ... | ... | 992 | 928 | 1,184 | ||
| Other Income | CZK mil | 2,770 | 2,226 | -494 | -1,873 | -233 | |||||||||||||||
| Total Revenues | CZK mil | 11,338 | 11,872 | 11,874 | 9,090 | 13,884 | |||||||||||||||
| Staff Cost | CZK mil | 3,299 | 3,252 | 3,569 | 3,399 | 4,131 | |||||||||||||||
| Depreciation | CZK mil | 760 | 842 | 1,505 | 1,423 | 1,719 | |||||||||||||||
| Other Cost | CZK mil | 2,418 | 2,227 | 2,134 | 2,059 | 2,690 | |||||||||||||||
| Operating Cost | CZK mil | 6,478 | 6,321 | 7,208 | 6,881 | 8,540 | |||||||||||||||
| Operating Profit | CZK mil | 4,860 | 5,551 | 4,666 | 2,209 | 5,344 | |||||||||||||||
| Provisions | CZK mil | 399 | 880 | 333 | 88.0 | 0 | |||||||||||||||
| Extra and Other Cost | CZK mil | -7.56 | -13.6 | -1,263 | -628 | -621 | |||||||||||||||
| Pre-Tax Profit | CZK mil | 4,469 | 4,684 | 5,596 | 2,749 | 5,965 | |||||||||||||||
| Tax | CZK mil | 1,211 | 869 | 865 | 525 | 1,195 | |||||||||||||||
| Minorities | CZK mil | 0 | 0 | 0 | 0 | 0 | |||||||||||||||
| Net Profit | CZK mil | 3,084 | 3,815 | 4,731 | 2,224 | 4,770 | |||||||||||||||
| Net Profit Avail. to Common | CZK mil | 3,084 | 3,815 | 4,731 | 2,224 | 4,770 | |||||||||||||||
| Dividends | CZK mil | ... | ... | ... | ... | ... | ... | ... | ... | ... | ... | ... | ... | ... | ... | ... | ... | ... | 0 | ||
| growth rates | |||||||||||||||||||||
| Net Interest Income Growth | % | ... | 4.42 | 16.8 | 18.0 | -13.2 | 29.4 | ||||||||||||||
| Net Fee Income Growth | % | ... | 18.2 | -1.19 | 67.7 | -6.23 | 27.2 | ||||||||||||||
| Total Revenue Growth | % | ... | 10.3 | 4.71 | 0.020 | -23.4 | 52.7 | ||||||||||||||
| Operating Cost Growth | % | ... | 5.97 | -2.42 | 14.0 | -4.54 | 24.1 | ||||||||||||||
| Operating Profit Growth | % | ... | 16.6 | 14.2 | -15.9 | -52.7 | 142 | ||||||||||||||
| Pre-Tax Profit Growth | % | ... | 36.0 | 4.81 | 19.5 | -50.9 | 117 | ||||||||||||||
| Net Profit Growth | % | ... | 18.4 | 23.7 | 24.0 | -53.0 | 114 | ||||||||||||||
| market share | |||||||||||||||||||||
| Market Share in Revenues | % | 6.33 | 6.24 | 5.87 | 5.04 | 7.53 | |||||||||||||||
| Market Share in Net Profit | % | 4.09 | 4.68 | 5.19 | 4.69 | 6.78 | |||||||||||||||
| Market Share in Employees | % | 6.92 | 7.10 | 7.13 | 6.63 | 9.57 | |||||||||||||||
| Market Share in Branches | % | 6.38 | 6.55 | 6.74 | 7.08 | 6.64 |
| balance sheet | Unit | 2004 | 2005 | 2006 | 2007 | 2008 | 2009 | 2010 | 2011 | 2012 | 2013 | 2014 | 2015 | 2016 | 2017 | 2018 | 2019 | 2020 | 2021 | 2022 | 2023 |
| balance sheet | |||||||||||||||||||||
| Cash & Cash Equivalents | CZK mil | 10,363 | 12,106 | 14,135 | 5,852 | 9,461 | |||||||||||||||
| Interbank Loans | CZK mil | 103,588 | 99,528 | 87,242 | 107,619 | 197,963 | |||||||||||||||
| Customer Loans | CZK mil | 218,987 | 236,604 | 246,644 | 249,083 | 371,751 | |||||||||||||||
| Retail Loans | CZK mil | 107,641 | 114,994 | 119,308 | 120,871 | 228,585 | |||||||||||||||
| Mortgage Loans | CZK mil | 86,789 | 93,528 | 95,242 | 96,094 | 98,547 | |||||||||||||||
| Consumer Loans | CZK mil | 20,852 | 21,465 | 24,066 | 24,777 | 130,038 | |||||||||||||||
| Corporate Loans | CZK mil | 108,194 | 115,847 | 133,454 | 131,928 | 134,223 | |||||||||||||||
| Investments | CZK mil | 1,067 | 10,785 | 4,777 | 43,237 | 41,150 | |||||||||||||||
| Property and Equipment | CZK mil | 4,270 | 4,779 | 6,936 | 4,098 | 4,199 | |||||||||||||||
| Intangible Assets | CZK mil | ... | ... | ... | ... | ... | ... | ... | ... | ... | ... | ... | ... | ... | ... | ... | 7,937 | 3,247 | 6,180 | ||
| Total Assets | CZK mil | 342,699 | 366,158 | 370,715 | 482,000 | 651,008 | |||||||||||||||
| Shareholders' Equity | CZK mil | 27,905 | 29,900 | 32,703 | 36,814 | 45,925 | |||||||||||||||
| Of Which Minority Interest | CZK mil | 0 | 0 | 0 | 0 | 0 | |||||||||||||||
| Liabilities | CZK mil | 314,794 | 336,258 | 338,012 | 445,186 | 605,083 | |||||||||||||||
| Interbank Borrowing | CZK mil | 31,372 | 34,402 | 21,961 | 12,201 | 13,107 | |||||||||||||||
| Customer Deposits | CZK mil | 251,732 | 270,921 | 290,691 | 402,776 | 553,090 | |||||||||||||||
| Retail Deposits | CZK mil | 140,422 | 154,539 | 166,958 | 260,993 | 376,420 | |||||||||||||||
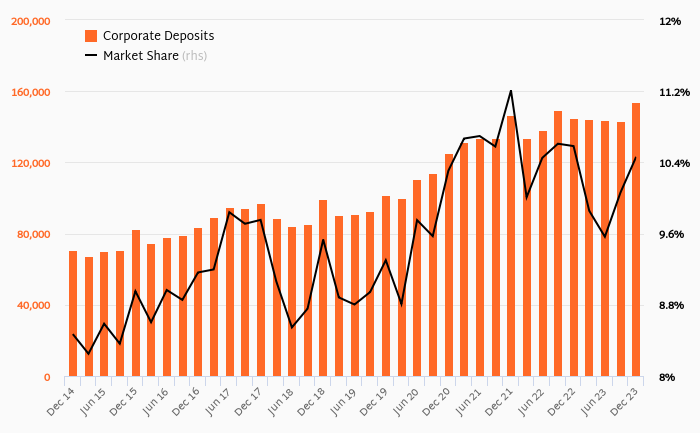
| Corporate Deposits | CZK mil | 96,895 | 99,549 | 101,748 | 125,617 | 154,803 | |||||||||||||||
| Sight Deposits | CZK mil | 227,863 | 242,944 | 257,938 | 336,583 | 448,505 | |||||||||||||||
| Term Deposits | CZK mil | 23,869 | 27,977 | 32,753 | 66,193 | 104,585 | |||||||||||||||
| Issued Debt Securities | CZK mil | 22,186 | 22,177 | 16,001 | 17,614 | 25,510 | |||||||||||||||
| Subordinated Debt | CZK mil | ... | ... | ... | ... | ... | ... | ... | ... | ... | ... | ... | ... | ... | ... | ... | 3,309 | 4,561 | 5,526 | ||
| Other Liabilities | CZK mil | 9,504 | 8,760 | 9,359 | 12,595 | 13,376 | |||||||||||||||
| asset quality | |||||||||||||||||||||
| Non-Performing Loans | CZK mil | 5,510 | 4,594 | 4,942 | 7,008 | 6,776 | |||||||||||||||
| Gross Loans | CZK mil | 224,039 | 241,056 | 250,396 | 304,681 | 377,239 | |||||||||||||||
| Risk-Weighted Assets | CZK mil | ... | ... | ... | ... | ... | ... | ... | ... | ... | ... | 111,400 | 159,225 | 164,567 | 161,404 | 174,540 | |||||
| Total Provisions | CZK mil | 5,052 | 4,451 | 3,752 | 5,931 | 5,488 | |||||||||||||||
| growth rates | |||||||||||||||||||||
| Customer Loan Growth | % | ... | 5.44 | 8.04 | 4.24 | 0.989 | 49.2 | ||||||||||||||
| Retail Loan Growth | % | ... | 9.83 | 6.83 | 3.75 | 1.31 | 89.1 | ||||||||||||||
| Mortgage Loan Growth | % | ... | 8.42 | 7.77 | 1.83 | 0.894 | 2.55 | ||||||||||||||
| Consumer Loan Growth | % | ... | 16.1 | 2.94 | 12.1 | 2.96 | 425 | ||||||||||||||
| Corporate Loan Growth | % | ... | -5.67 | 7.07 | 15.2 | -1.14 | 1.74 | ||||||||||||||
| Total Asset Growth | % | ... | 7.67 | 6.85 | 1.24 | 30.0 | 35.1 | ||||||||||||||
| Shareholders' Equity Growth | % | ... | 11.3 | 7.15 | 9.37 | 12.6 | 24.7 | ||||||||||||||
| Customer Deposit Growth | % | ... | 10.7 | 7.62 | 7.30 | 38.6 | 37.3 | ||||||||||||||
| Retail Deposit Growth | % | ... | 22.4 | 10.1 | 8.04 | 56.3 | 44.2 | ||||||||||||||
| Corporate Deposit Growth | % | ... | -12.4 | 2.74 | 2.21 | 23.5 | 23.2 | ||||||||||||||
| market share | |||||||||||||||||||||
| Market Share in Customer Loans | % | 7.10 | 7.16 | 7.15 | 6.93 | 9.66 | ... | ||||||||||||||
| Market Share in Corporate Loans | % | 10.6 | 10.7 | 11.9 | 11.7 | 11.3 | |||||||||||||||
| Market Share in Retail Loans | % | 7.05 | 7.00 | 6.84 | 6.50 | 11.2 | |||||||||||||||
| Market Share in Consumer Loans | % | 5.46 | 5.37 | 5.79 | 5.86 | 29.0 | |||||||||||||||
| Market Share in Mortgage Loans | % | 7.56 | 7.51 | 7.16 | 6.69 | 6.18 | |||||||||||||||
| Market Share in Total Assets | % | 4.89 | 5.03 | 4.90 | 6.05 | 7.64 | |||||||||||||||
| Market Share in Customer Deposits | % | 6.04 | 6.09 | 6.13 | 7.80 | 10.1 | |||||||||||||||
| Market Share in Retail Deposits | % | 5.92 | 6.04 | 6.13 | 8.54 | 11.5 | |||||||||||||||
| Market Share in Corporate Deposits | % | 9.72 | 9.56 | 9.29 | 10.3 | 11.8 |
| ratios | Unit | 2004 | 2005 | 2006 | 2007 | 2008 | 2009 | 2010 | 2011 | 2012 | 2013 | 2014 | 2015 | 2016 | 2017 | 2018 | 2019 | 2020 | 2021 | 2022 | 2023 |
| ROE | % | ... | 11.6 | 13.2 | 15.1 | 6.40 | 11.5 | ||||||||||||||
| ROTE | % | ... | ... | ... | ... | ... | ... | ... | ... | ... | ... | ... | ... | ... | ... | ... | ... | 7.63 | 13.0 | ||
| ROE (@ 15% of RWA) | % | ... | ... | ... | ... | ... | ... | ... | ... | ... | ... | ... | 18.7 | 18.8 | 19.5 | 9.10 | 18.9 | ||||
| ROA | % | ... | 0.933 | 1.08 | 1.28 | 0.522 | 0.842 | ||||||||||||||
| Return on Loans | % | 1.45 | 1.67 | 1.96 | 0.897 | 1.54 | |||||||||||||||
| Operating Profit (As % of RWA) | % | ... | ... | ... | ... | ... | ... | ... | ... | ... | ... | ... | 4.42 | 4.10 | 2.88 | 1.36 | 3.18 | ||||
| Costs (As % Of Assets) | % | ... | 1.96 | 1.78 | 1.96 | 1.61 | 1.51 | ||||||||||||||
| Costs (As % Of Income) | % | 57.1 | 53.2 | 60.7 | 75.7 | 61.5 | |||||||||||||||
| Costs (As % Of Loans) | % | ... | 3.04 | 2.77 | 2.98 | 2.78 | 2.75 | ||||||||||||||
| Costs (As % Of Loans & Deposits) | % | ... | 1.43 | 1.29 | 1.38 | 1.16 | 1.08 | ||||||||||||||
| Capital Adequacy Ratio | % | 17.7 | 16.9 | 18.7 | 22.8 | 26.1 | |||||||||||||||
| Tier 1 Ratio | % | ... | ... | ... | ... | ... | ... | 16.1 | 14.9 | 16.5 | 19.6 | 23.1 | |||||||||
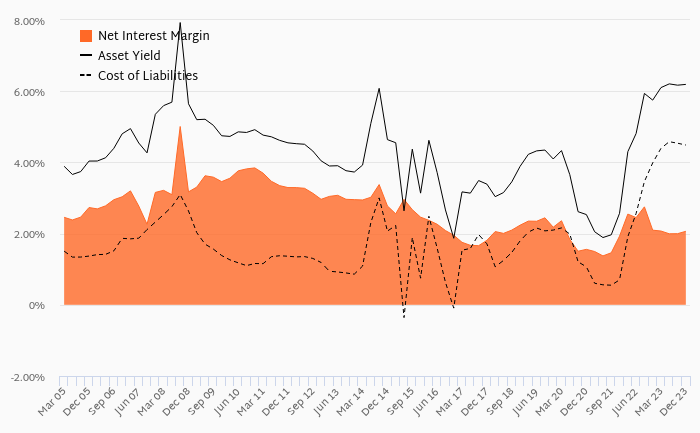
| Net Interest Margin | % | ... | 1.99 | 2.16 | 2.46 | 1.84 | 1.79 | ||||||||||||||
| Interest Spread | % | ... | 1.91 | 2.05 | 2.28 | 1.79 | 1.76 | ||||||||||||||
| Asset Yield | % | ... | 2.85 | 3.42 | 4.37 | 2.44 | 2.24 | ||||||||||||||
| Revenues (As % of RWA) | % | ... | ... | ... | ... | ... | ... | ... | ... | ... | ... | ... | 10.3 | 8.77 | 7.33 | 5.58 | 8.27 | ||||
| Cost Of Liabilities | % | ... | 0.939 | 1.37 | 2.09 | 0.650 | 0.478 | ||||||||||||||
| Payout Ratio | % | ... | ... | ... | ... | ... | ... | ... | ... | ... | ... | ... | ... | ... | ... | ... | ... | ... | 0 | ||
| Interest Income (As % Of Revenues) | % | 57.9 | 64.6 | 76.2 | 86.3 | 73.1 | |||||||||||||||
| Fee Income (As % Of Revenues) | % | 17.7 | 16.7 | 28.0 | 34.3 | 28.5 | |||||||||||||||
| Other Income (As % Of Revenues) | % | 24.4 | 18.8 | -4.16 | -20.6 | -1.68 | |||||||||||||||
| Staff Cost (As % Of Total Cost) | % | 50.9 | 51.4 | 49.5 | 49.4 | 48.4 | |||||||||||||||
| Equity (As % Of Assets) | % | 8.14 | 8.17 | 8.82 | 7.64 | 7.05 | |||||||||||||||
| Equity (As % Of Loans) | % | 12.7 | 12.6 | 13.3 | 14.8 | 12.4 | |||||||||||||||
| Loans (As % Of Deposits) | % | 87.0 | 87.3 | 84.8 | 61.8 | 67.2 | |||||||||||||||
| Loans (As % Assets) | % | 63.9 | 64.6 | 66.5 | 51.7 | 57.1 | |||||||||||||||
| NPLs (As % Of Loans) | % | 2.46 | 1.91 | 1.97 | 2.30 | 1.80 | |||||||||||||||
| Provisions (As % Of NPLs) | % | 91.7 | 96.9 | 75.9 | 84.6 | 81.0 | |||||||||||||||
| Provisions (As % Of Loans) | % | 2.31 | 1.88 | 1.52 | 2.38 | 1.48 | |||||||||||||||
| Cost of Provisions (As % Of Loans) | % | ... | 0.187 | 0.386 | 0.138 | 0.036 | 0 |
| other data | Unit | 2004 | 2005 | 2006 | 2007 | 2008 | 2009 | 2010 | 2011 | 2012 | 2013 | 2014 | 2015 | 2016 | 2017 | 2018 | 2019 | 2020 | 2021 | 2022 | 2023 |
| Branches | 124 | 128 | 128 | 119 | 106 | ||||||||||||||||
| ATMs | ... | ... | ... | ... | ... | ... | ... | ... | ... | ... | ... | 53.0 | 88.0 | 106 | ... | ... | ... | ... | |||
| ATMs (As % of Bank Branches) | % | ... | ... | ... | ... | ... | ... | ... | ... | ... | ... | ... | 42.7 | 68.8 | 82.8 | ... | ... | ... | ... | ||
| Employees | 2,900 | 2,972 | 2,966 | 2,699 | 3,801 | ||||||||||||||||
| Employees Per Bank Branch | 23.4 | 23.2 | 23.2 | 22.7 | 35.9 | ||||||||||||||||
| Cost Per Employee | USD per month | 4,040 | 4,168 | 4,449 | 4,769 | 4,180 | |||||||||||||||
| Cost Per Employee (Local Currency) | CZK per month | 94,794 | 91,186 | 100,289 | 104,946 | 90,568 |
| customer breakdown | Unit | 2004 | 2005 | 2006 | 2007 | 2008 | 2009 | 2010 | 2011 | 2012 | 2013 | 2014 | 2015 | 2016 | 2017 | 2018 | 2019 | 2020 | 2021 | 2022 | 2023 |
| Customers | mil | 1.14 | 1.14 | 1.21 | 1.25 | 1.99 | |||||||||||||||
| Number of Primary Customers | mil | ... | ... | ... | ... | ... | ... | ... | ... | ... | ... | ... | ... | ... | ... | ... | ... | ... | ... | ||
| Number of Mortgages | mil | ... | ... | ... | ... | ... | ... | ... | ... | ... | 0.062 | 0.064 | 0.066 | 0.067 | ... | ... | ... | ||||
| Average Size of Mortgage Loan | CZK | ... | ... | ... | ... | ... | ... | ... | ... | ... | 1,393,000 | 1,451,000 | 1,444,000 | 1,444,000 | ... | ... | ... | ||||
| Primary (As % of Total Clients) | % | ... | ... | ... | ... | ... | ... | ... | ... | ... | ... | ... | ... | ... | ... | ... | ... | ... | ... | ||
| Mortgages (As % of Total Clients) | % | ... | ... | ... | ... | ... | ... | ... | ... | ... | 5.46 | 5.63 | 5.45 | 5.31 | ... | ... | ... | ||||
| Revenue per Customer (Local Currency) | CZK | 9,939 | 10,369 | 9,817 | 7,252 | 6,993 | |||||||||||||||
| Net Profit per Customer (Local Currency) | CZK | 2,703 | 3,332 | 3,912 | 1,774 | 2,403 | |||||||||||||||
| Loan per Customer (Local Currency) | CZK | 191,973 | 206,666 | 203,917 | 198,732 | 187,245 | |||||||||||||||
| Deposit per Customer (Local Currency) | CZK | 220,678 | 236,640 | 240,334 | 321,357 | 278,583 | |||||||||||||||
| Revenue per Customer | USD | 424 | 474 | 435 | 330 | 323 | |||||||||||||||
| Net Profit per Customer | USD | 115 | 152 | 174 | 80.6 | 111 | |||||||||||||||
| Loan per Customer | USD | 9,017 | 9,199 | 9,015 | 9,292 | 8,530 | |||||||||||||||
| Deposit per Customer | USD | 10,365 | 10,533 | 10,624 | 15,026 | 12,691 |
Get all company financials in excel:

By Helgi Library - May 11, 2024
Raiffeisenbank Czech Republic's customer loans reached CZK 361,222 mil in 2023-09-30, up 1.54% compared to the previous year. Czech banking sector provided customer loans of CZK 4,290 bil in 2023-09-30, up 1.99% when compared to the last year. Raiffeisenb...
By Helgi Library - May 11, 2024
Raiffeisenbank Czech Republic made a net profit of CZK 1,534 mil under revenues of CZK 4,752 mil in the fourth quarter of 2023, down 26.1% and 2.2% respectively when compared to the same period last year. Historically, the bank’s net profit reached an all time hi...
By Helgi Library - May 11, 2024
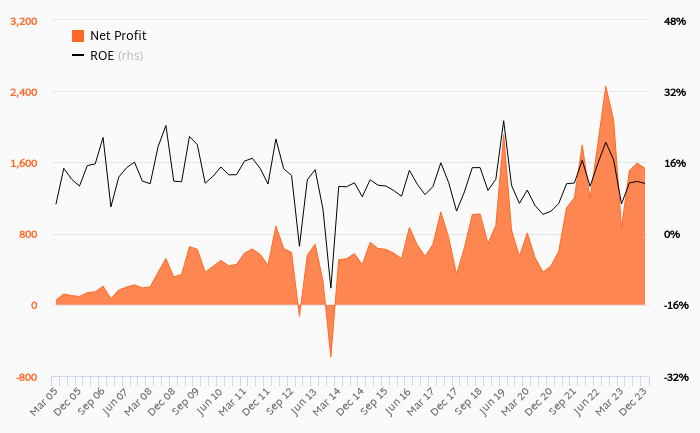
Raiffeisenbank Czech Republic made a net profit of CZK 1,534 mil in the fourth quarter of 2023, down 26.1% when compared to the same period of last year. This implies a return on equity of 11.3%. Historically, the bank’s net profit reached an all time high of CZK...
By Helgi Library - May 11, 2024
Raiffeisenbank Czech Republic's non-performing loans reached 1.46% of total loans at the end of 2023-12-31, up from 1.45% compared to the previous year. Historically, the NPL ratio hit an all time high of 7.29% in 2010-09-30 and an all time low of 1.45% in 2023-0...
By Helgi Library - May 11, 2024
Raiffeisenbank Czech Republic's retail loans reached CZK 183,242 mil in the fourth quarter of 2023, up 2.28% compared to the previous year. Czech banking sector provided retail loans of CZK 2,242 bil in 4Q2023, up 0.906% when compared to the last year. Ra...
By Helgi Library - May 11, 2024
Raiffeisenbank Czech Republic employed 3,240 persons in 2023-12-31, up 0.527% when compared to the previous year. Historically, the bank's workforce hit an all time high of 3,384 persons in 2022-09-30 and an all time low of 2,302 in 2007-12-31. Average cost reache...
By Helgi Library - May 11, 2024
Raiffeisenbank Czech Republic's consumer loans reached CZK 50,000 mil in 2023-12-31, up 1.01% compared to the previous year. Czech banking sector provided consumer loans of CZK 500 bil in 2023-12-31, up 1.45% when compared to the last year. Raiffeisenbank...
By Helgi Library - May 11, 2024
Raiffeisenbank Czech Republic's loans reached in the first quarter of 1970, down from when compared to the previous quarter and down from when compared to the same period of last year. Historically, the bank’s loans reached an all time high of ...
By Helgi Library - May 11, 2024
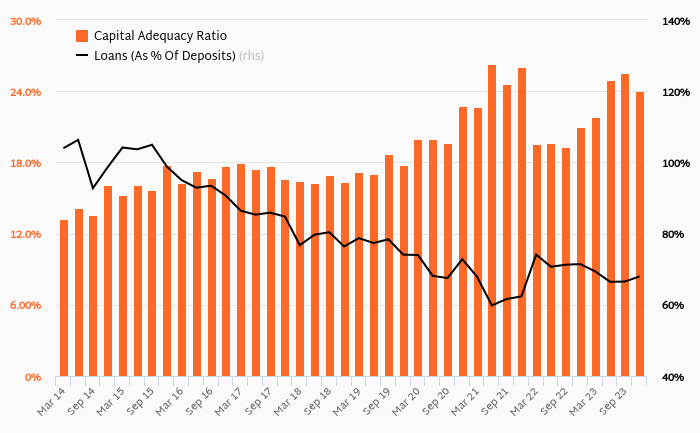
Raiffeisenbank Czech Republic's capital adequacy ratio reached 24.0% at the end of fourth quarter of 2023, down from 25.5% when compared to the previous quarter. Historically, the bank’s capital ratio hit an all time high of 26.3% in 2Q2021 and an all time low of 1...
By Helgi Library - May 11, 2024
Raiffeisenbank Czech Republic's retail deposits reached CZK 333,658 mil in 2023-12-31, down 0.292% compared to the previous year. Czech banking sector accepted retail deposits of CZK 3,651 bil in 2023-12-31, up 2.05% when compared to the last year. Raiffe...
Raiffeisenbank Czech Republic is the medium-sized bank with a 5-8% market share in the key retail product . From a greenfield start-up back in 1993, the bank acquired a purely Internet bank, e-banka, in 2006. Originally a corporate-oriented bank, Raiffeisen has been focusing increasingly on the retail area. In 2019, the Bank operated a network of more than 130 branches and employed more than 3,000 people in the Czech Republic.

Raiffeisenbank Czech Republic has been growing its revenues and asset by 8.15% and 14.1% a year on average in the last 10 years. Its loans and deposits have grown by 11.2% and 15.0% a year during that time and loans to deposits ratio reached 72.3% at the end of 2023. The company achieved an average return on equity of 11.9% in the last decade with net profit growing 22.5% a year on average. In terms of operating efficiency, its cost to income ratio reached 47.3% in 2023, compared to 57.9% average in the last decade.
Equity represented 7.93% of total assets or 13.7% of loans at the end of 2023. Raiffeisenbank Czech Republic's non-performing loans were 1.47% of total loans while provisions covered some 88.2% of NPLs at the end of 2023.
 Helgi Library