By Helgi Library - September 25, 2020
Ferrari made a net profit of EUR 166 mil with revenues of EUR 932 mil in 1Q2020, down by 6.89% and down by 0.837%, re...
By Helgi Library - October 12, 2020
Ferrari's total assets reached EUR 5,568 mil at the end of 1Q2020, up 4.45% compared to the previous year. Current...
By Helgi Library - September 25, 2020
Ferrari's operating cash flow stood at EUR 263 mil in 1Q2020, down 31.6% when compared to the previous year. Historicall...
| Profit Statement |
| Balance Sheet |
| Ratios |
| Valuation |
Get all company financials in excel:
Get all company financials in excel:


By Helgi Library - September 25, 2020
Ferrari made a net profit of EUR 696 mil with revenues of EUR 3,767 mil in 2019, down by 11.3% and up by 10.1%, respectively, compared to the previous year. This translates into a net margin of 18.5%. On the operating level, EBITDA reached EUR 1,109 mil, ...
By Helgi Library - September 25, 2020
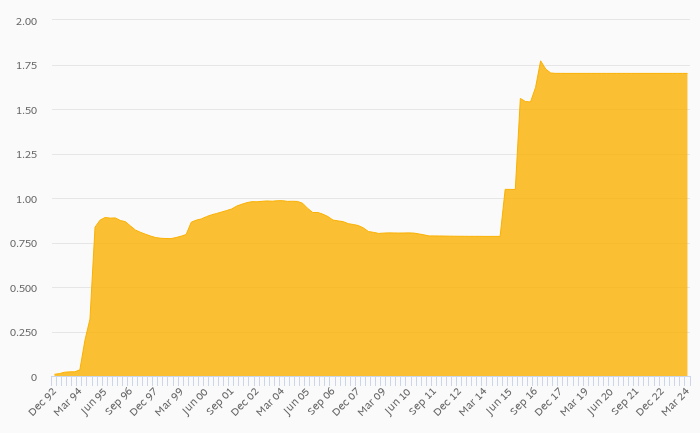
Ferrari stock traded at EUR 147 per share at the end 2019 translating into a market capitalization of USD 30,505 mil. Since the end of 2014, stock has appreciated by 174% representing an annual average growth of 22.4%. In absolute terms, the value of th...
By Helgi Library - September 25, 2020
Ferrari stock traded at EUR 147 per share at the end 2019 implying a market capitalization of USD 30,505 mil. Since the end of 2014, stock has appreciated by 174% implying an annual average growth of 22.4% In absolute terms, the value of the company rose...
By Helgi Library - September 25, 2020
Ferrari's operating cash flow stood at EUR 1,306 mil in 2019, up 39.8% when compared to the previous year. Historically, between 2012 - 2019, the firm’s operating cash flow reached a high of EUR 1,306 mil in 2019 and a low of EUR 426 mil in 2014. ...
By Helgi Library - September 25, 2020
Ferrari invested a total of EUR 701 mil in 2019, up 10.1% compared to the previous year. Historically, between 2012 - 2019, the company's investments stood at a high of EUR 701 mil in 2019 and a low of EUR 256 mil in 2012. As a percen...
By Helgi Library - September 25, 2020
Ferrari's total assets reached EUR 5,446 mil at the end of 2019, up 12.3% compared to the previous year. Current assets amounted to EUR 2,641 mil, or 48.5% of total assets while cash stood at EUR 898 mil at the end of 2019. ...
By Helgi Library - September 25, 2020
Ferrari made a net profit of EUR 696 mil with revenues of EUR 3,767 mil in 2019, down by 11.3% and up by 10.1%, respectively, compared to the previous year. This translates into a net margin of 18.5%. Historically, between 2012 and 2019, the firm’...
By Helgi Library - September 25, 2020
Ferrari made a net profit of EUR 696 mil in 2019, down 11.3% compared to the previous year. Historically, between 2012 and 2019, the company's net profit reached a high of EUR 785 mil in 2018 and a low of EUR 225 mil in 2012. The result implies a return o...
By Helgi Library - September 25, 2020
Ferrari's net debt stood at EUR 1,192 mil and accounted for 80.1% of equity at the end of 2019. The ratio is down 3.59 pp compared to the previous year. Historically, the firm’s net debt to equity reached a high of 422% in 2016 and a low of -...
By Helgi Library - September 25, 2020
Ferrari stock traded at EUR 147 per share at the end 2019 translating into a market capitalization of USD 30,505 mil. Since the end of 2014, the stock has appreciated by 174% representing an annual average growth of 22.4%. At the end of 2019, the firm tr...
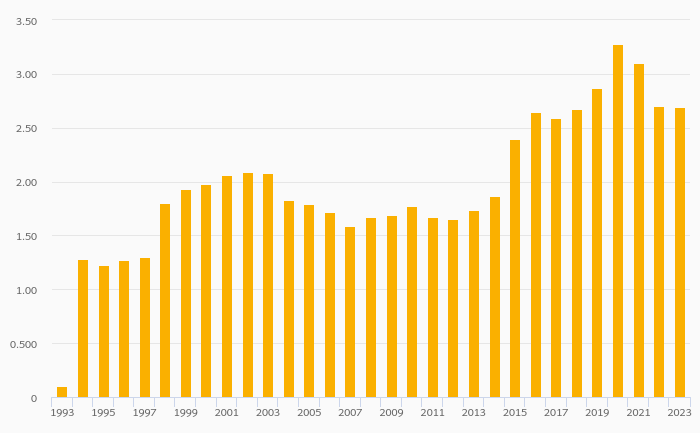
Ferrari has been growing its sales by 6.40% a year on average in the last 5 years. EBITDA has grown on average by 15.5% a year during that time to total of EUR 1,109 mil in 2019, or 29.4% of sales. That’s compared to 27.5% average margin seen in last five years.
The company netted EUR 696 mil in 2019 implying ROE of 49.0% and ROCE of 27.5%. Again, the average figures were 99.8% and 25.5%, respectively when looking at the previous 5 years.
Ferrari’s net debt amounted to EUR 1,192 mil at the end of 2019, or 80.1% of equity. When compared to EBITDA, net debt was 1.07x, down when compared to average of 1.61x seen in the last 5 years.
Ferrari stock traded at EUR 147 per share at the end of 2019 resulting in a market capitalization of USD 30,505 mil. Over the previous five years, stock price grew by 174% or 22.4% a year on average. The closing price put stock at a 12-month trailing EV/EBITDA of 25.3x and price to earnings (PE) of 39.1x as of 2019.
 Helgi Library