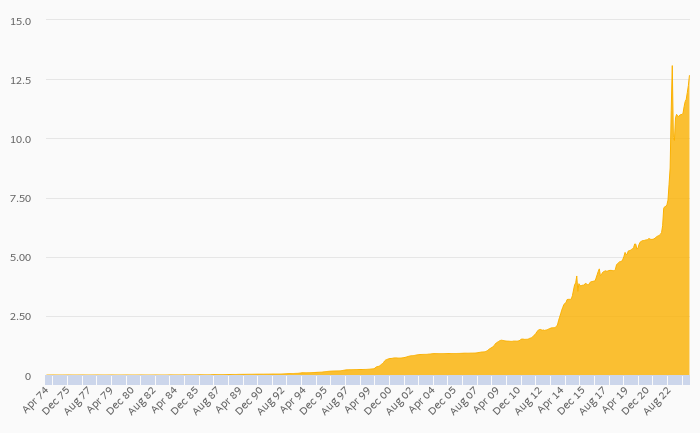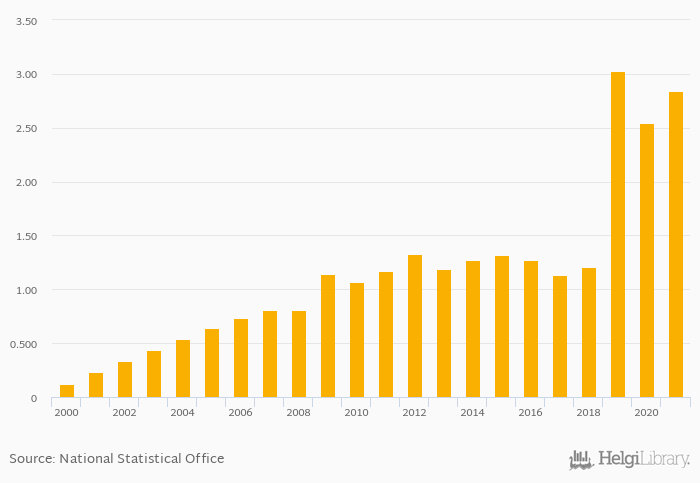
Onion consumption per capita rose 11.8% to 2.84 kg in Rwanda in 2021, according to Faostat.
Historically, onion consumption per capita in Rwanda reached an all time high of 3.03 kg in 2019 and an all time low of 0.120 kg in 2000. When compared to Rwanda's main peers, onion consumption per capita in Burundi amounted to 0.030 kg, 2.41 kg in Tanzania, 7.07 kg in Uganda and 0.660 kg in Dem. Republic of the Congo in 2021.
Rwanda has been ranked 130th within the group of 156 countries we follow in terms of onion consumption per capita, 11 places above the position seen 10 years ago.
| Onion Consumption Per Capita | Unit | 2001 | 2002 | 2003 | 2004 | 2005 | 2006 | 2007 | 2008 | 2009 | 2010 | 2011 | 2012 | 2013 | 2014 | 2015 | 2016 | 2017 | 2018 | 2019 | 2020 | 2021 |
| Angola | kg | 1.05 | 0.910 | 0.880 | 0.620 | 0.630 | ||||||||||||||||
| Burundi | kg | ... | ... | ... | ... | ... | ... | ... | ... | ... | ... | ... | 0.010 | 0.010 | 0.010 | 0.040 | 0.040 | |||||
| Central African Republic | kg | ... | ... | ... | ... | ... | ... | ... | ... | ... | ... | 0.020 | 0.050 | 0.020 | 0.110 | 2.03 | ||||||
| Congo | kg | 2.68 | 2.95 | 3.01 | 2.98 | 2.63 | ||||||||||||||||
| Dem. Republic of the Congo | kg | ... | ... | ... | ... | ... | ... | ... | ... | ... | 0.830 | 0.800 | 0.780 | 0.770 | 0.690 | |||||||
| Kenya | kg | 1.53 | 0.950 | 0.820 | 1.05 | 1.94 | ||||||||||||||||
| Mozambique | kg | 5.45 | 7.13 | 8.15 | 9.04 | 11.4 | ||||||||||||||||
| Rwanda | kg | 1.32 | 1.27 | 1.13 | 1.21 | 3.03 | ||||||||||||||||
| South Sudan | kg | ... | ... | ... | ... | ... | ... | ... | ... | ... | ... | ... | ... | ... | ... | ... | ... | ... | ... | 0.190 | ... | ... |
| Tanzania | kg | 3.43 | 3.65 | 3.76 | 3.96 | 2.75 | ||||||||||||||||
| Uganda | kg | 7.96 | 7.91 | 8.06 | 8.18 | 7.00 | ||||||||||||||||
| Zambia | kg | 2.79 | 2.86 | 2.50 | 2.30 | 2.32 |
 Helgi Library