Sales of new cars increased by 156 thousand in August compared to last year
In the first eight months of the year, the growth reached 17.9% yoy
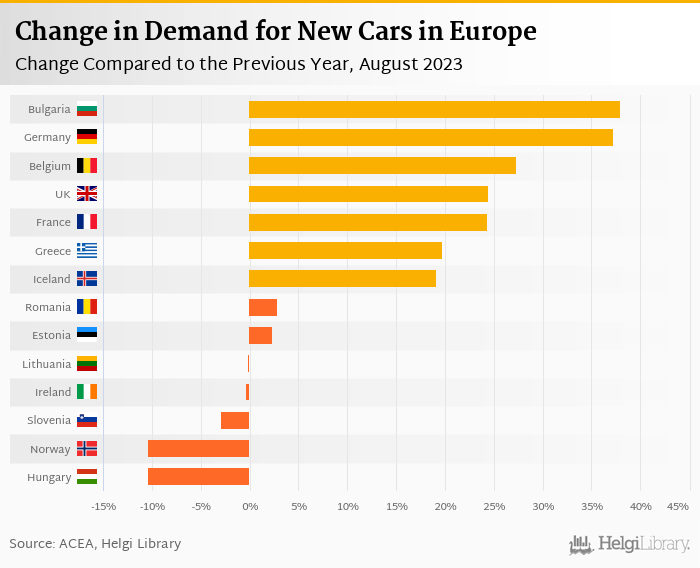
Bulgaria performed relatively the best (up 37.9% yoy) while sales in Hungary showed the weakest change compared to the last year (down 10.4% yoy)
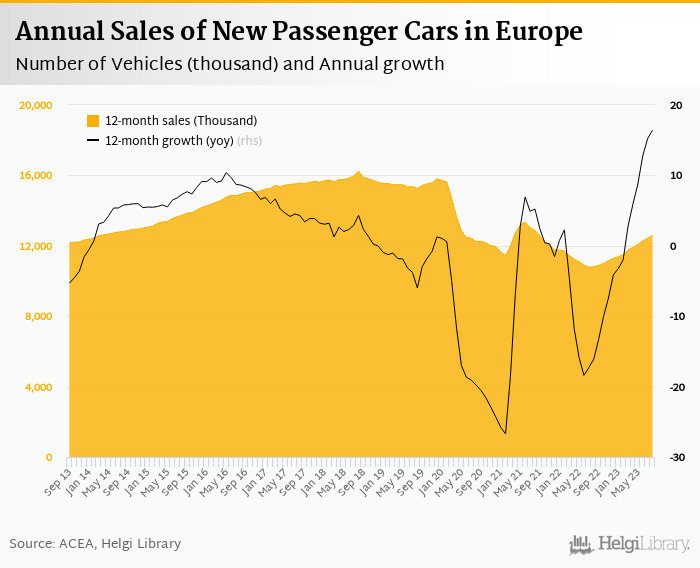
Sales of new passenger cars reached 905 thousand in August 2023 in the enlarged Europe (EU plus Iceland, Norway and Switzerland), according to ACEA. This is 20.8%, or 156 thousand more than in the previous year. In the first eight months of 2023, some 8,515 thousand cars were sold in Europe, up 17.9% yoy.
In August 2023, the EU car market expanded by 21%, reaching 787,626 registered units, marking the thirteenth consecutive month of growth. So far this year, new EU car registrations grew 17.9% totalling 7.1mil units, still almost 2 mil short when compared to the pre-COVID-pandemic level in 2019. More than 20% of new cars sold were battery-electric in August (up from 12% last year), while hybrid-electric cars held a 24% market share.
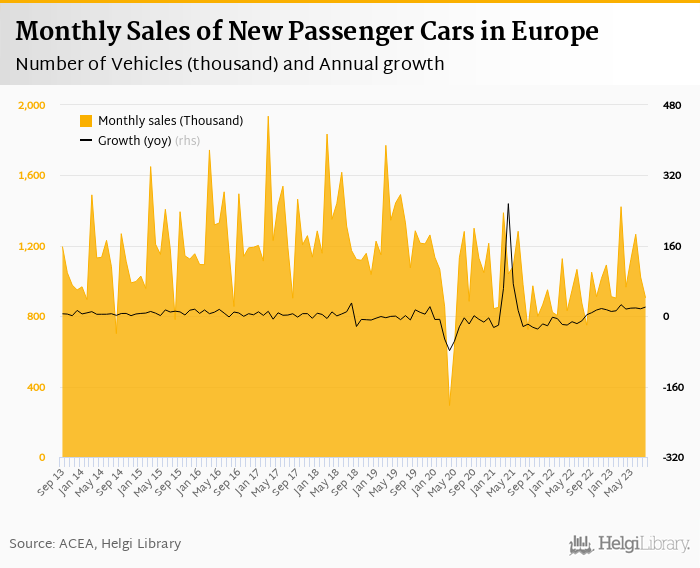
Historically, between 1990 and 2023, sales of passenger cars in Europe reached a high of 1,937 thousand in March 2017 and a low of 292 thousand in April 2020.
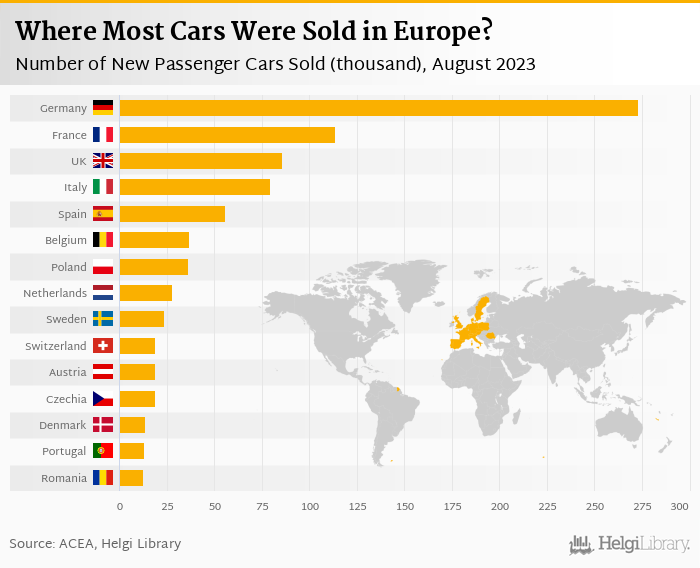
In August, most vehicles (273 thousand) were sold in Germany (up 37.3% yoy), followed by France (114 thousand, up 24.3%), the United Kingdom with 85.7 thousand cars (up 24.4%), 79.7 thousand new vehicles were registered in Italy (up 12.0%) and 56.0 thousand in Spain (up 7.80%). The five largest countries accounted for 61.1% of total new vehicles registered in August 2023.
In absolute terms, the best performance in sales of new cars has been seen in Germany (up 74.2 thousand cars) and France (up 22.2 thousand cars). At the other end of the scale, Norway and Hungary showed the weakest change in registration of new cars in August when compared to last year (down 1.28 thousand and down 1.04 thousand cars, respectively).
In relative terms, sales in Bulgaria (+37.9%) and Germany (+37.3%) performed the best compared to a year ago, whereas registration in Hungary and Norway the worst (-10.4% and -10.4% yoy), in August 2023, according to ACEA:
In the first eight months of the year, some 8,515 thousand cars were sold in Europe, up 17.9% yoy. The table below shows details of the sales for each of the European country:
| Country | August 2023 | August 2022 | YOY Change % | 1-8/2023 | 1-8/2022 | YOY Change % |
|---|---|---|---|---|---|---|
| Austria | 18.8 | 17.8 | 5.48 | 163 | 142 | 14.4 |
| Belgium | 36.8 | 28.9 | 27.3 | 336 | 250 | 34.1 |
| Bulgaria | 3.42 | 2.48 | 37.9 | 23.3 | 19.9 | 17.4 |
| Croatia | 3.43 | 3.20 | 7.09 | 42.0 | 31.2 | 34.6 |
| Cyprus | 0.736 | 0.644 | 14.3 | 10.1 | 7.89 | 27.9 |
| Czechia | 18.7 | 16.6 | 12.9 | 150 | 129 | 16.6 |
| Denmark | 13.6 | 12.8 | 6.27 | 109 | 96.1 | 13.5 |
| Estonia | 1.77 | 1.73 | 2.31 | 15.7 | 14.4 | 9.39 |
| Finland | 7.82 | 7.11 | 9.98 | 61.1 | 56.1 | 8.88 |
| France | 114 | 91.4 | 24.3 | 1,132 | 971 | 16.6 |
| Germany | 273 | 199 | 37.3 | 1,914 | 1,643 | 16.5 |
| Greece | 10.4 | 8.66 | 19.8 | 93.1 | 74.4 | 25.2 |
| Hungary | 8.95 | 9.99 | -10.4 | 73.8 | 76.4 | -3.40 |
| Iceland | 1.17 | 0.979 | 19.1 | 12.7 | 11.9 | 6.97 |
| Ireland | 8.11 | 8.14 | -0.332 | 113 | 95.2 | 18.4 |
| Italy | 79.7 | 71.2 | 12.0 | 1,040 | 865 | 20.3 |
| Latvia | 1.60 | 1.49 | 7.39 | 13.2 | 11.1 | 19.0 |
| Lithuania | 2.24 | 2.25 | -0.178 | 19.2 | 18.4 | 4.53 |
| Luxembourg | 3.42 | 2.97 | 15.1 | 34.1 | 28.5 | 19.7 |
| Malta | 0.660 | 4.43 | 0 | |||
| Netherlands | 27.8 | 23.6 | 17.7 | 259 | 200 | 29.5 |
| Norway | 11.1 | 12.4 | -10.4 | 85.2 | 88.1 | -3.36 |
| Poland | 36.2 | 33.8 | 7.18 | 311 | 281 | 10.8 |
| Portugal | 13.1 | 11.3 | 15.0 | 139 | 101 | 37.5 |
| Romania | 12.9 | 12.5 | 2.82 | 100 | 83.3 | 20.2 |
| Slovakia | 7.49 | 6.70 | 11.8 | 60.9 | 52.9 | 15.3 |
| Slovenia | 3.24 | 3.34 | -2.96 | 34.4 | 33.0 | 4.18 |
| Spain | 56.0 | 51.9 | 7.80 | 643 | 533 | 20.6 |
| Sweden | 23.9 | 20.6 | 16.0 | 182 | 183 | -0.415 |
| Switzerland | 19.0 | 16.4 | 15.8 | 161 | 142 | 13.9 |
| United Kingdom | 85.7 | 68.9 | 24.4 | 1,179 | 983 | 20.0 |
| EU + EFTA | 905 | 749 | 20.8 | 8,515 | 7,222 | 17.9 |
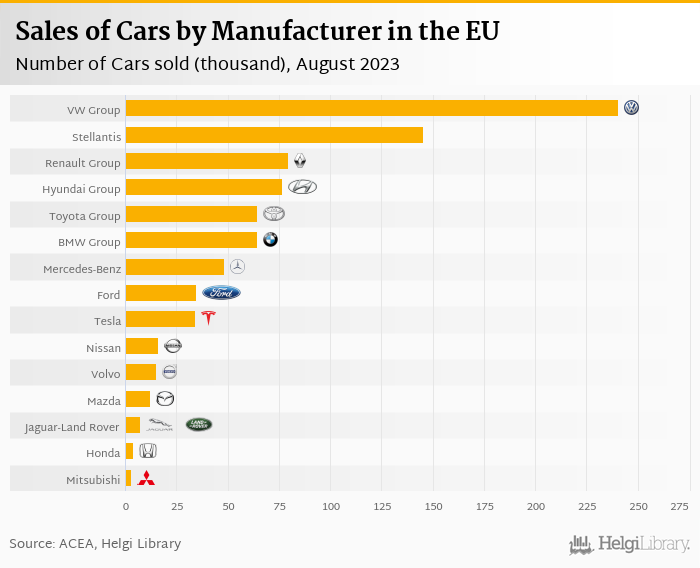
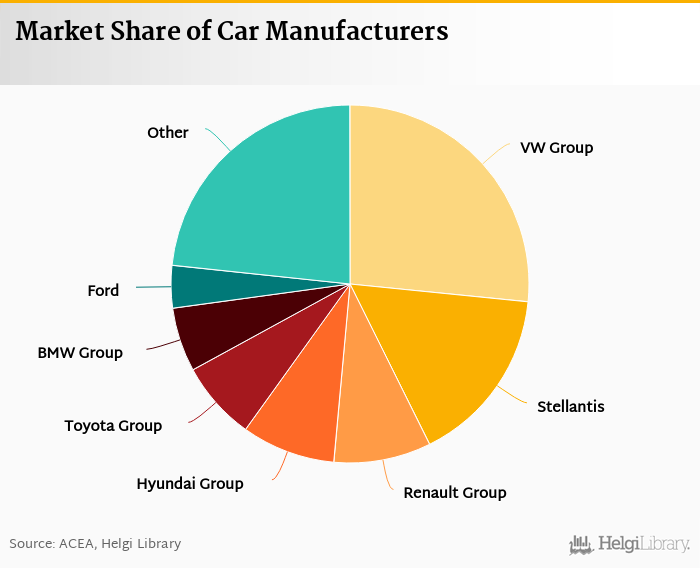
Volkswagen Group sold the most cars in August 2023 in Europe, some 240 thousand vehicles representing 26.6% of the European market. Sales of Renault Group amounted to 79.5 thousand vehicles (or 8.80% of the market) while Hyundai Group and Toyota Group held 8.50% and 7.10% of the European market in August. Overall, the five largest manufacturers sold 58.1% of all new cars in August:
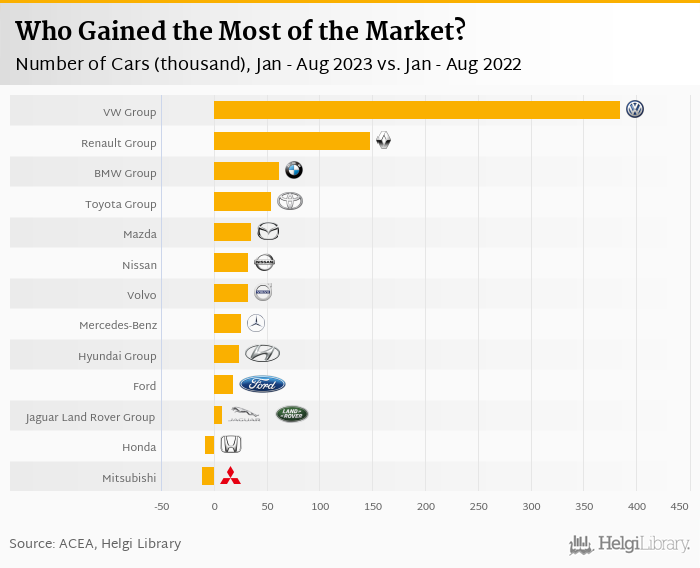
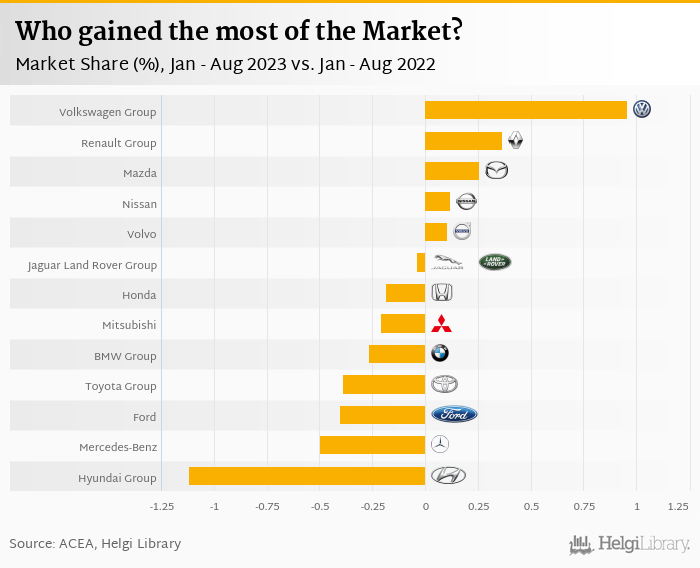
When compared to last year, Volkswagen Group has gained the most in terms of market share rising its market position by 0.958 bp, followed by Renault (up 0.367 bp) and Mazda Motor Corporation (up 0.256 bp). Hyundai Motor Company were on the other end of the market spectrum dropping 1.12 bp on the market alongside with Daimler Group (down 0.496 bp) and Ford Motor Company (-0.405 bp):
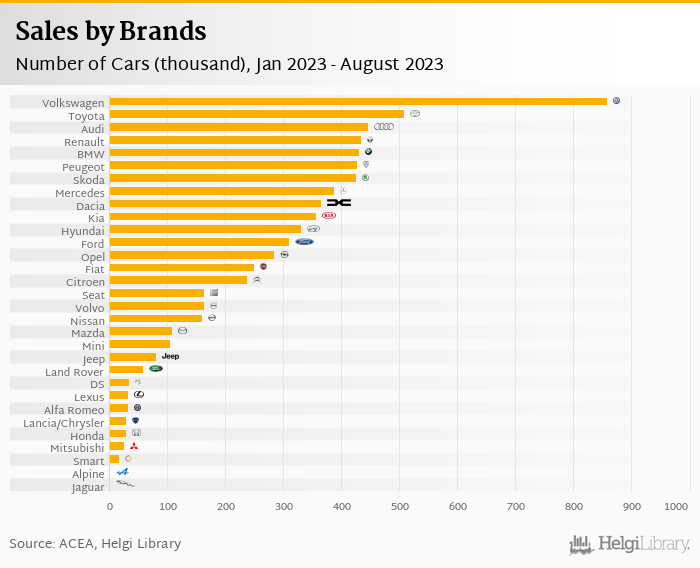
In terms of particular brands, Volkswagen stands out as the most favorite brand accounting for 859 thousand sold vehicles, or 10.1% of all new passenger cars sold on the European market from the beginning of the year.
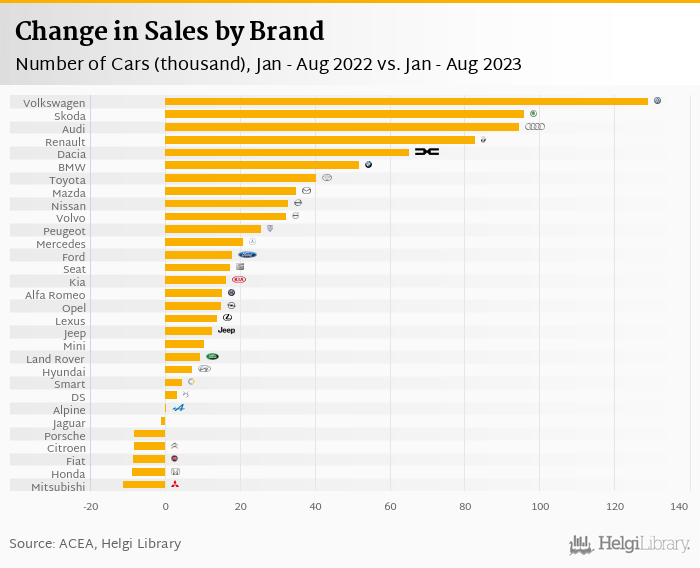
In terms of momentum, Skoda gained the most in terms of market share when compared to last year (up 0.433 bp) followed by Audi and Mazda. Citroen and Hyundai were on the other end of the market spectrum losing -0.617 bp and -0.596 bp respectively:
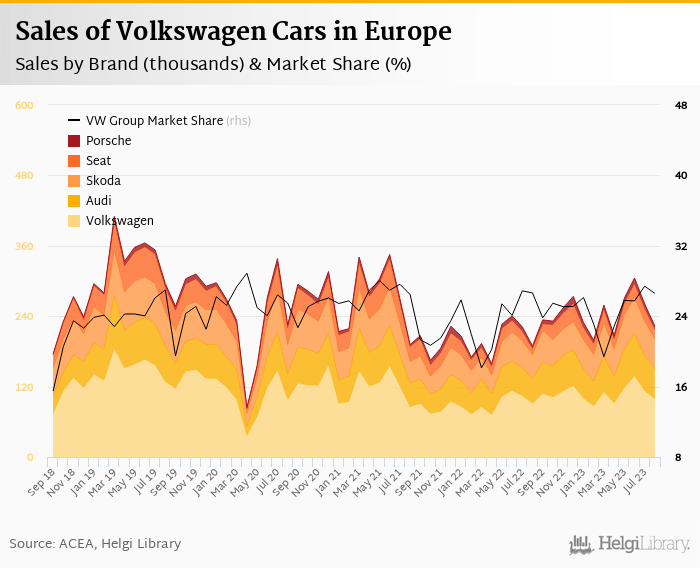
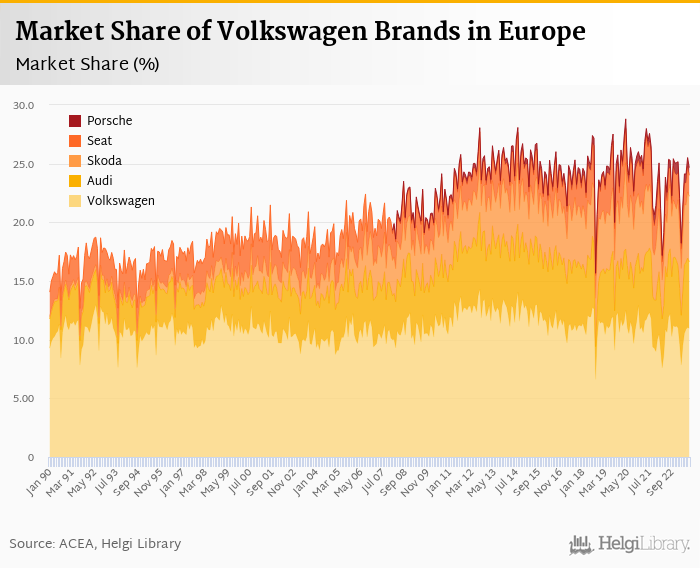
Volkswagen Group sold 240 thousand new passenger cars representing a 26.6% share of all new passenger cars sold in Europe in August 2023. This is 20.5% more vehicles and a 0.059 pp decrease in market share when compared to last year. Looking back three years, VW's market share was 25.5%.
The Group sold 99.3 thousand of Volkswagen brand cars in August, followed by 51.3 thousand of Audis and 50.4 thousand of Skodas. Cupra sold 16.9 thousand vehicles, Seat sold 16.2 thousand and Porsche some 5.92 thousand cars in August 2023:
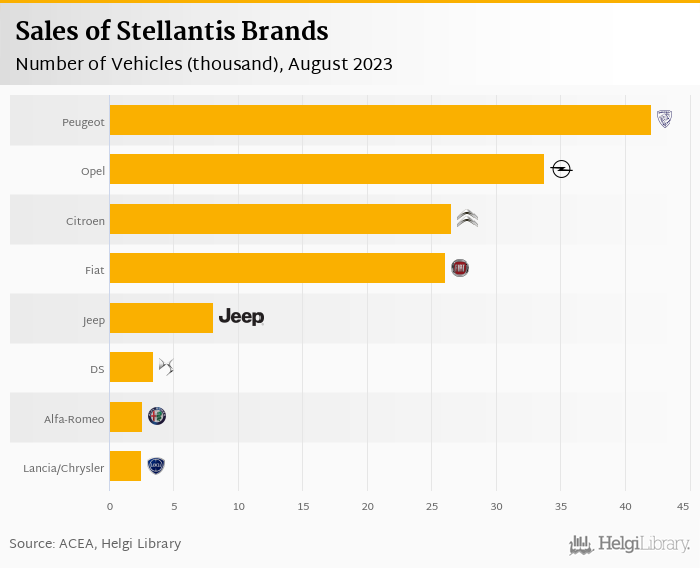
Stellantis sold 145 thousand new passenger cars representing a 16.1% share of all new passenger cars sold in Europe in August 2023. This is 6.34% more vehicles and a 2.18 pp decrease in market share when compared to last year.
The Group sold 42.0 thousand of Peugeot brand cars in August, followed by 33.8 thousand of Opels and 26.6 thousand of Citroens. Fiat sold 26.1 thousand vehicles, Jeep sold 8.09 thousand, Ds sold 3.38, Alfa-romeo sold 2.55 thousand, and Lancia-chrysler some 2.50 cars in August 2023:
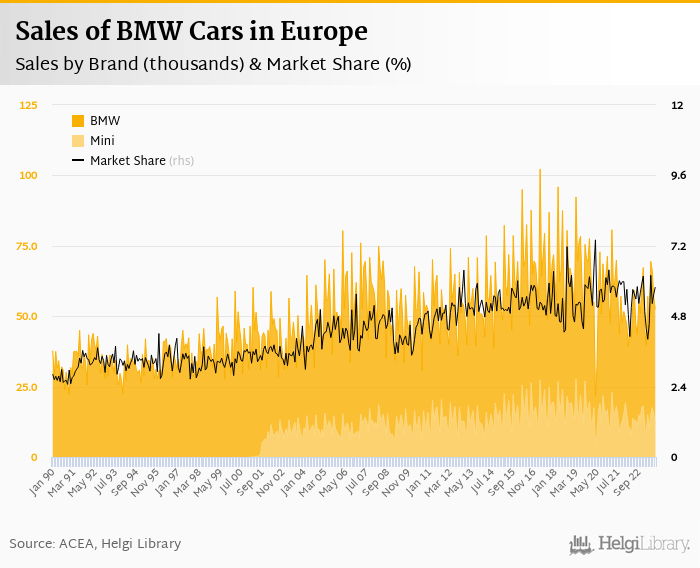
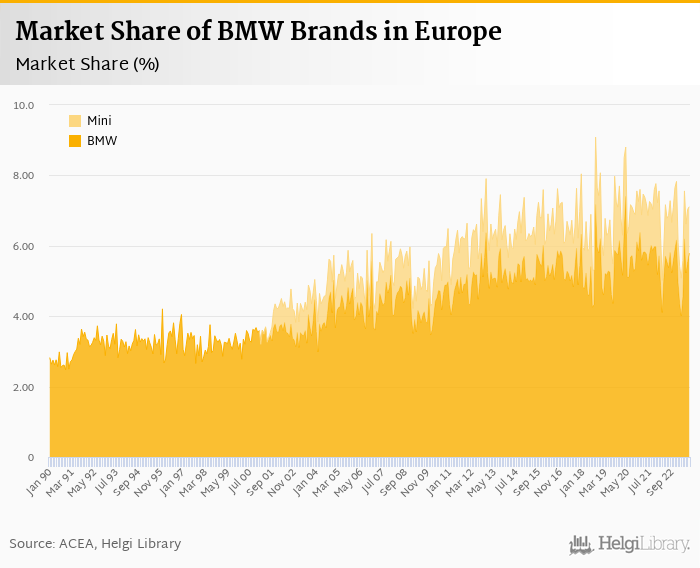
BMW Group sold 64.3 thousand new passenger cars representing a 7.11% share of all new passenger cars sold in Europe in August 2023. This is 17.9% more vehicles and a 0.171 pp decrease in market share when compared to last year. Compared to three years ago, BMW Group's market share is now 0.013 pp higher.
The group sold 52.4 thousand of BMW brand cars, followed by 11.9 thousand of Minis in August 2023:
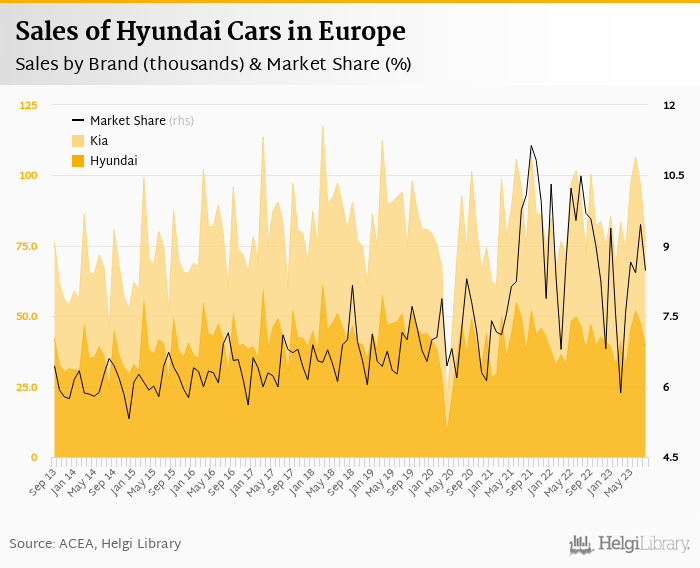
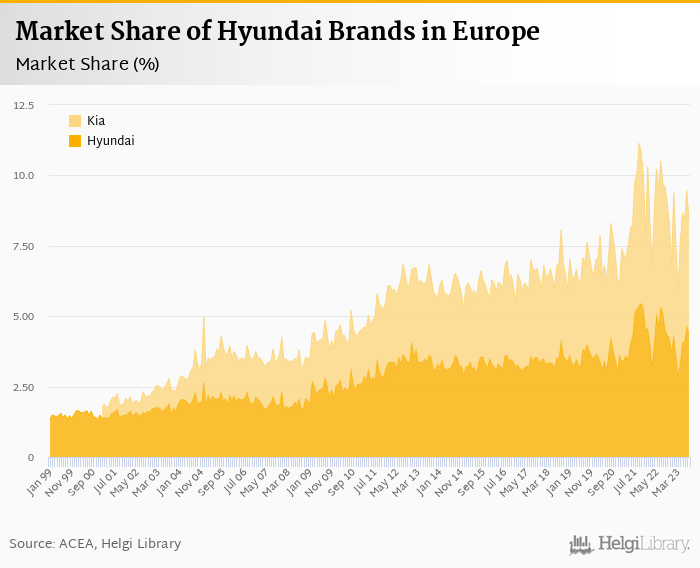
Hyundai Group sold 76.6 thousand new passenger cars representing a 8.47% share of all new passenger cars sold in Europe in August 2023. This is 5.57% more vehicles and a 1.22 pp decrease in market share when compared to last year. Compared to three years ago, Hyundai Group's market share is now 0.174 pp higher.
The group sold 39.5 thousand of Hyundai brand cars, followed by 37.1 thousand of Kias in August 2023:
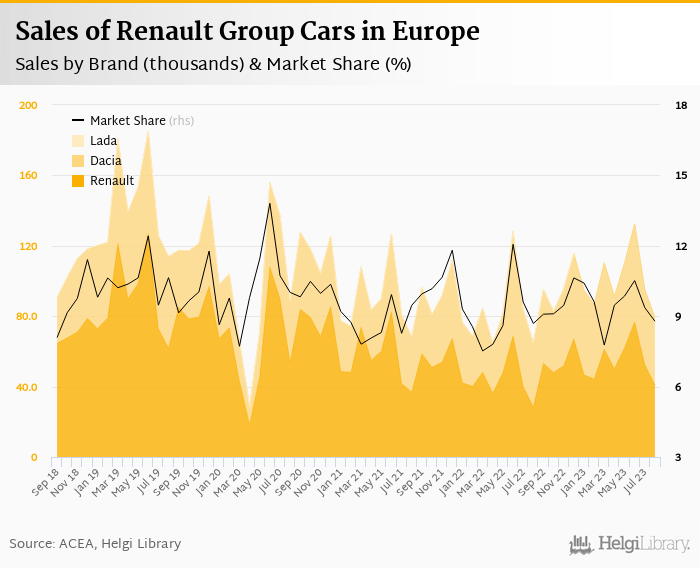
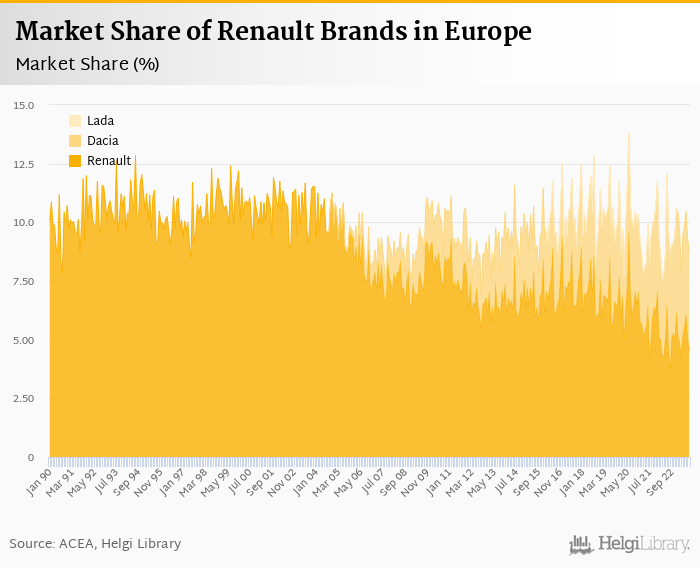
Renault Group sold 79.5 thousand new passenger cars representing a 8.79% share of all new passenger cars sold in Europe in August 2023. This is 22.1% more vehicles and a 0.097 pp increase in market share when compared to last year. By comparison, three years ago, Renault Group's market share was 10.0%.
The group sold 41.0 thousand of Renault brand cars in August, followed by 38.2 thousand of Dacias and of s:
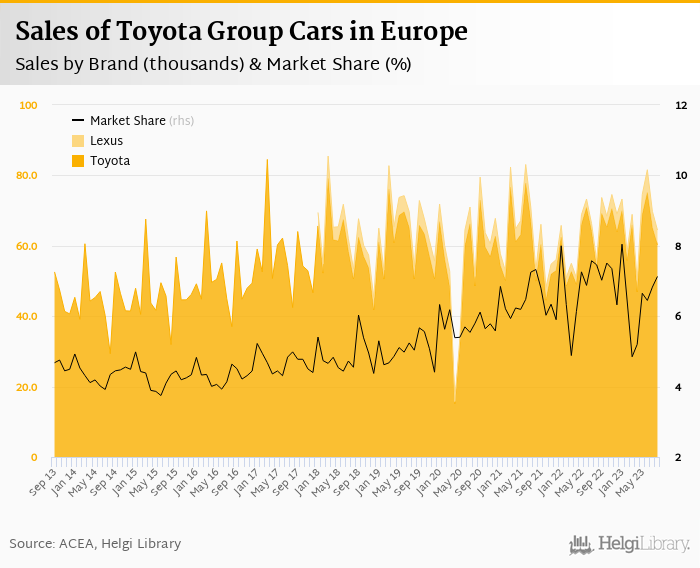
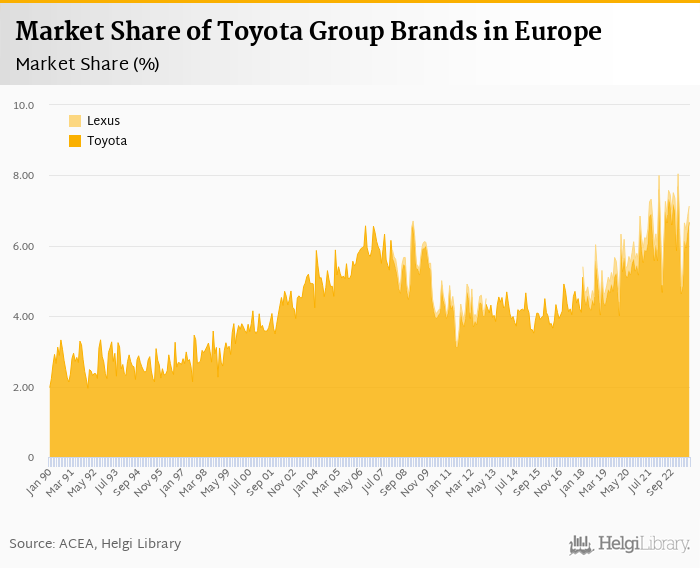
Toyota Group sold 64.5 thousand new passenger cars representing a 7.13% share of all new passenger cars sold in Europe in August 2023. This is 15.4% more vehicles and a 0.330 pp decrease in market share when compared to last year. Toyota Group's market share three years ago, by comparison, stood at 5.80%.
The group sold 60.3 thousand of Toyota brand cars in August, with Lexus following at 4.18 thousand cars:
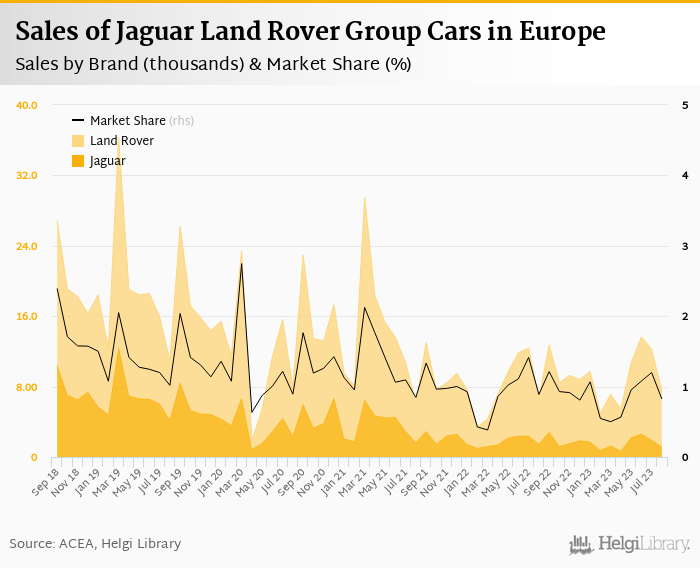
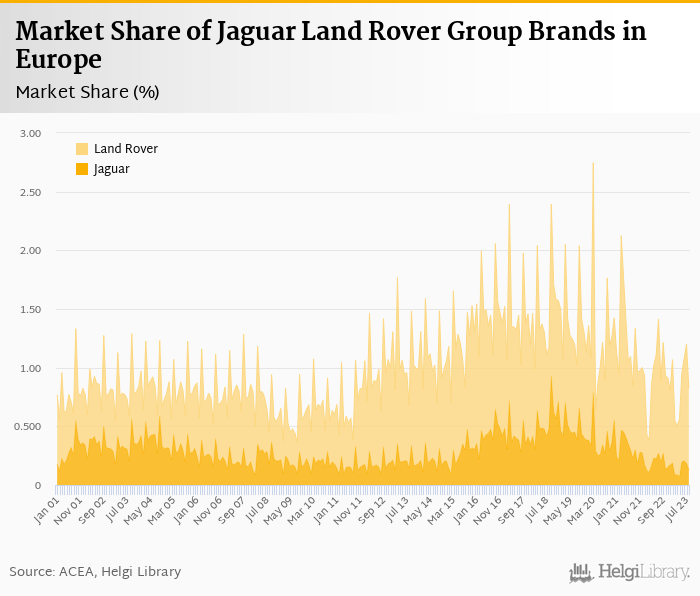
Jaguar Land Rover Group sold 7.44 thousand new passenger cars representing a 0.823% share of all new passenger cars sold in Europe in August 2023. This is 11.8% more vehicles and a 0.066 pp decrease in market share when compared to last year. Three years ago however, the market share of Jaguar Land Rover Group was 0.893%.
The group sold 6.28 thousand of Land Rovers in August, followed by 1.16 thousand of Jaguars:
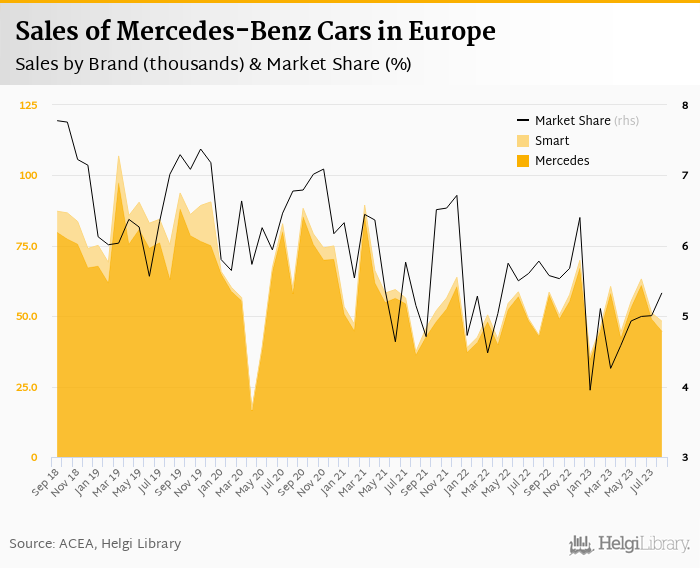
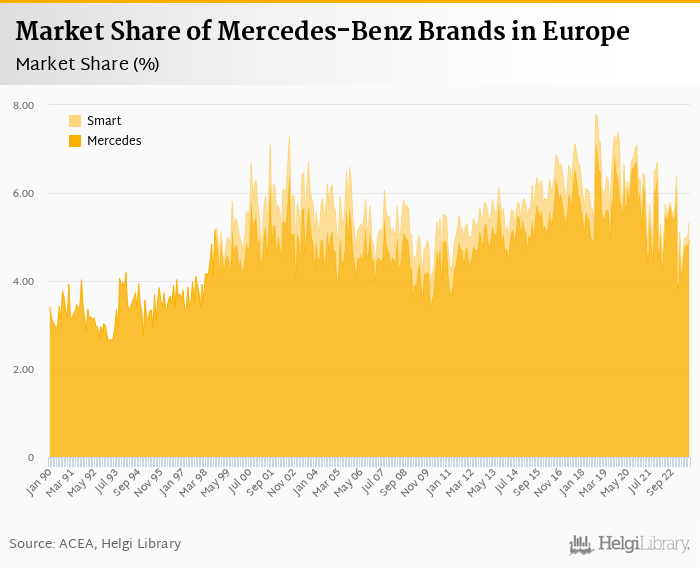
Mercedes-Benz sold 48.2 thousand new passenger cars representing a 5.33% share of all new passenger cars sold in Europe in August 2023. This is 11.4% more vehicles and a 0.451 pp decrease in market share when compared to last year. By comparison, three years ago, Mercedes-Benz's market share was 6.78%.
The group sold 44.6 thousand of Mercedes in August, followed by 3.59 thousand of Smart cars:
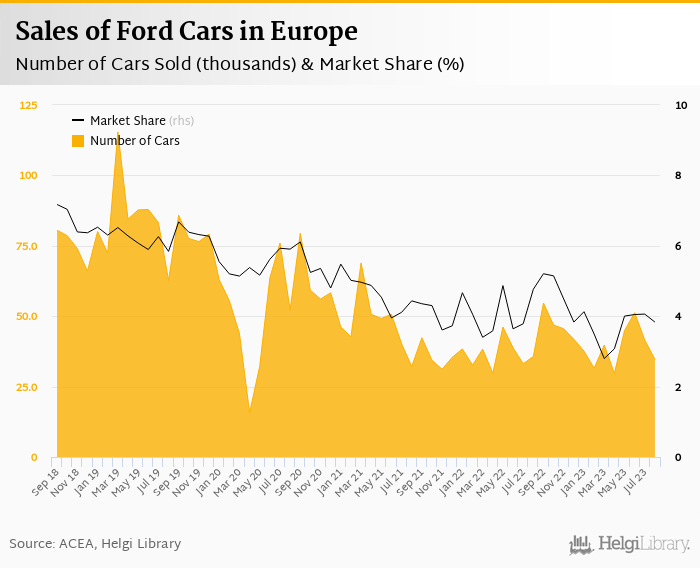
Ford sold 34.7 thousand new passenger cars representing a 3.83% share of all new passenger cars sold in Europe in August 2023. This is 2.88% fewer vehicles and a 0.934 pp decrease in market share when compared to last year. Compared to three years ago, Ford's market share is now 2.07 pp lower.
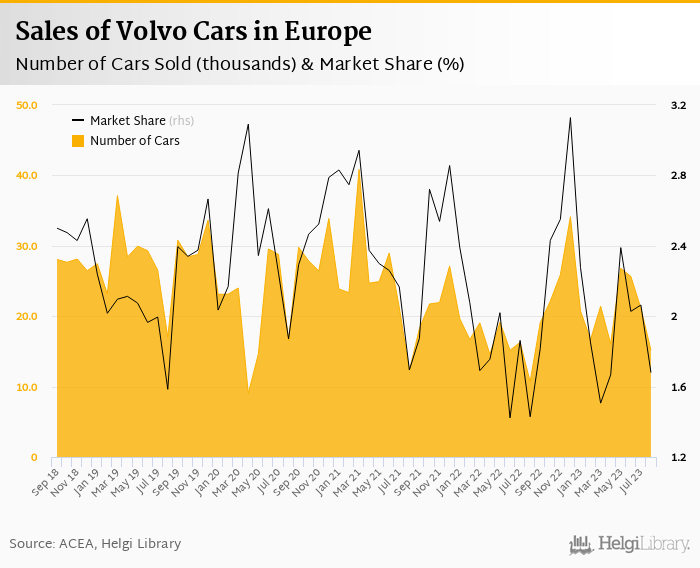
Volvo sold 15.2 thousand new passenger cars representing a 1.68% share of all new passenger cars sold in Europe in August 2023. This is 42.0% more vehicles and a 0.251 pp increase in market share when compared to last year. Compared to three years ago, Volvo's market share is now 0.192 pp lower.
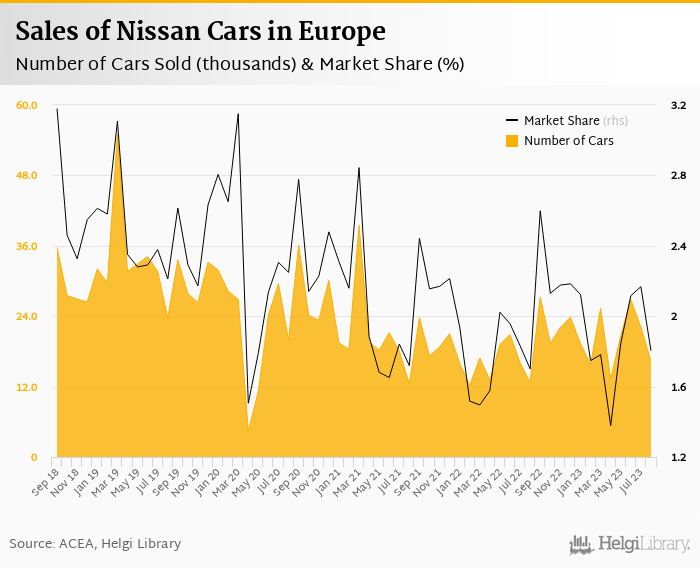
Nissan sold 16.3 thousand new passenger cars representing a 1.80% share of all new passenger cars sold in Europe in August 2023. This is 28.1% more vehicles and a 0.103 pp increase in market share when compared to last year. Compared to three years ago, Nissan's market share is now 0.446 pp lower.
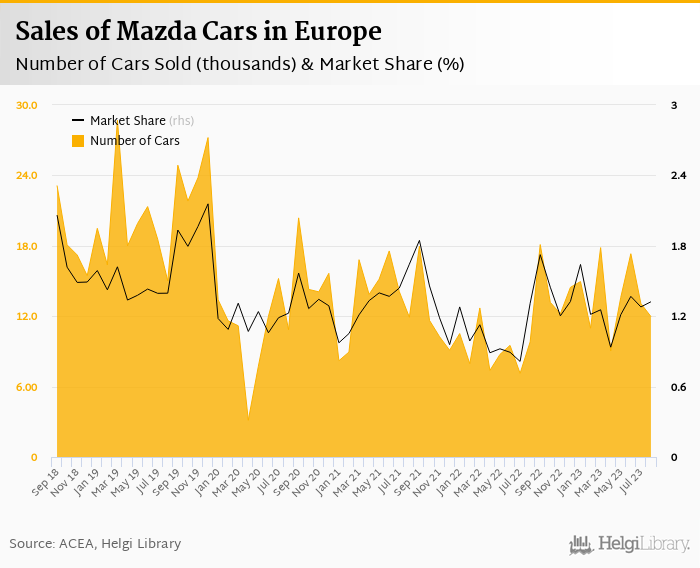
Mazda sold 12.0 thousand new passenger cars representing a 1.32% share of all new passenger cars sold in Europe in August 2023. This is 22.0% more vehicles and a 0.013 pp increase in market share when compared to last year. Compared to three years ago, Mazda's market share is now 0.097 pp higher.
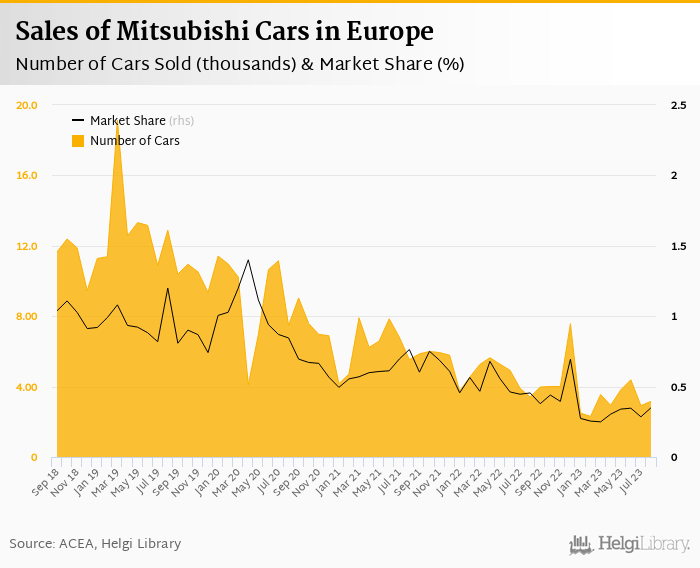
Mitsubishi sold 3.16 thousand new passenger cars representing a 0.349% share of all new passenger cars sold in Europe in August 2023. This is 7.28% fewer vehicles and a 0.106 pp decrease in market share when compared to last year. Compared to three years ago, Mitsubishi's market share is now 0.496 pp lower.
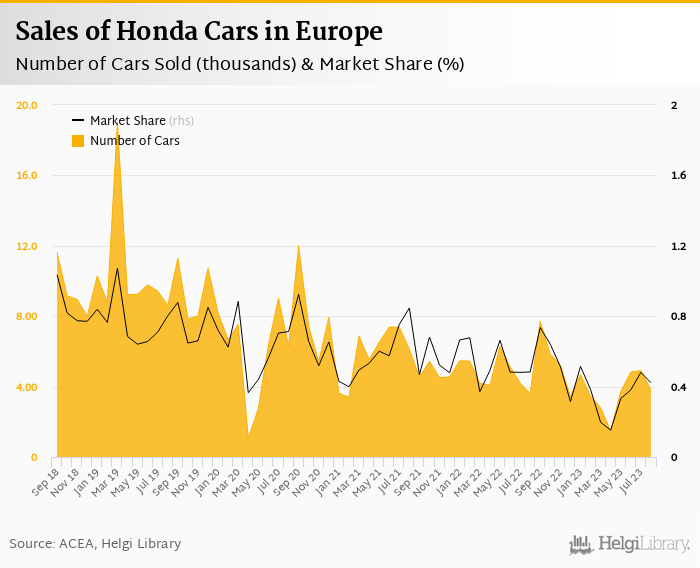
Honda sold 3.82 thousand new passenger cars representing a 0.422% share of all new passenger cars sold in Europe in August 2023. This is 5.50% more vehicles and a 0.061 pp decrease in market share when compared to last year. Compared to three years ago, Honda's market share is now 0.291 pp lower.
Tesla sold 34.1 thousand new passenger cars representing a 3.77% share of all new passenger cars sold in Europe in August 2023. This is 242% more vehicles and a 2.44 pp increase in market share when compared to last year.
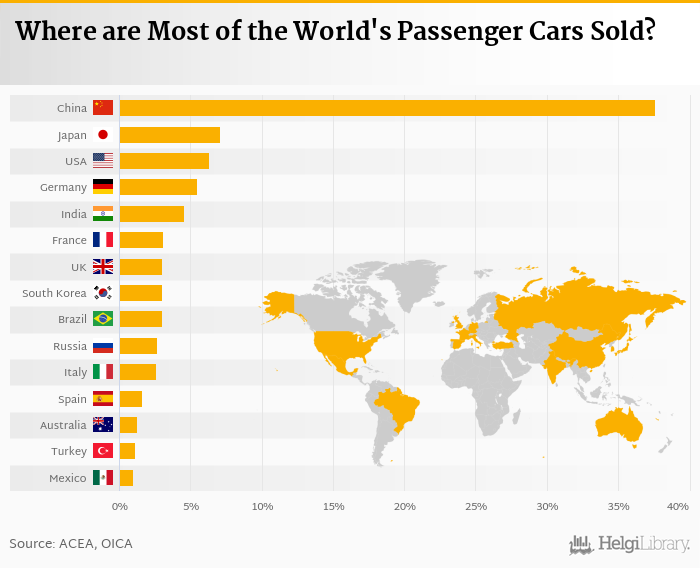
Based on a comparison of 64 countries, China ranked the highest with 20,178 thousand passenger cars sold in 2020 followed by Japan and the USA. Total sales of passenger cars reached 53,599 thousand in 2020 in the world, according to ACEA. This is 15.9% less than in the previous year and 3.98% less than 10 years ago. Historically, total sales of passenger cars reached an all time high of 70,695 thousand in 2017 and an all time low of 11,000 thousand in 1961. The average annual growth stands at 2.39% since 1960.
The top ranked country, China, accounted for 37.6% of all passenger cars sold in the world. The top 3 countries held a 51.1% share while the ten largest countries some 75.9% in 2020.
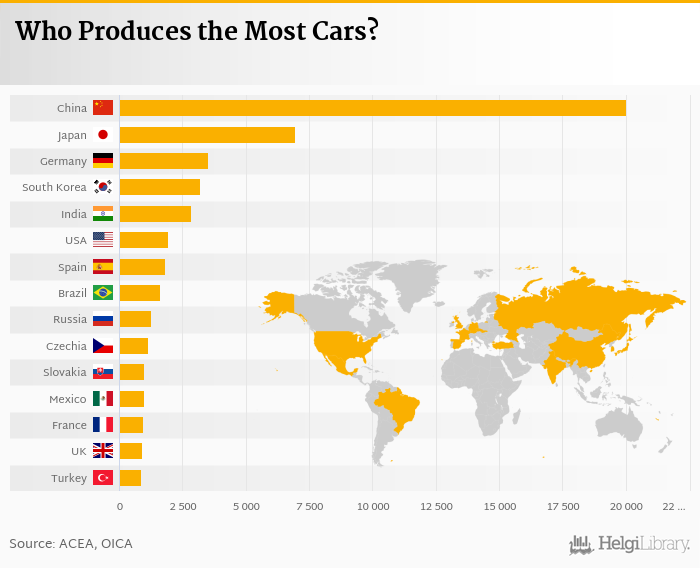
China was the largest car producer in 2020 with 19,994 thousand followed by Japan and Germany. Total production of passenger cars reached 55,834 thousand in 2020 in the world, according to ACEA. China accounted for 35.8% of the world's production, while the top 3 countries held a 54.6% share and the ten largest countries some 79.3% in 2020:
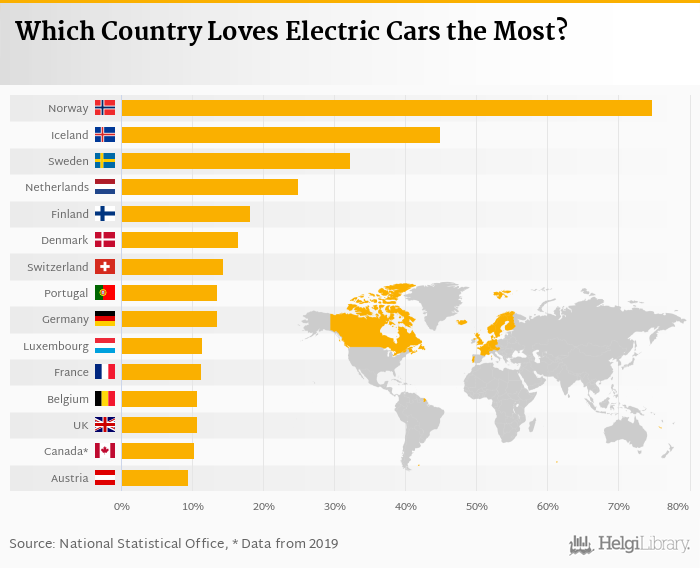
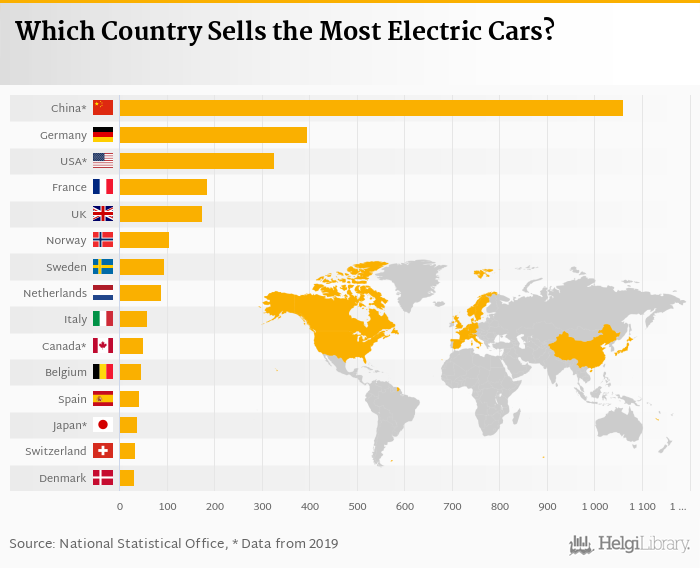
Based on a comparison of 29 countries, Germany ranked the highest in sales of electric cars with 395 thousand followed by France and United Kingdom in 2020. When looking at the ratio of electric to total new cars sold, Norway ranked the highest with 74.8% followed by Iceland and Sweden:
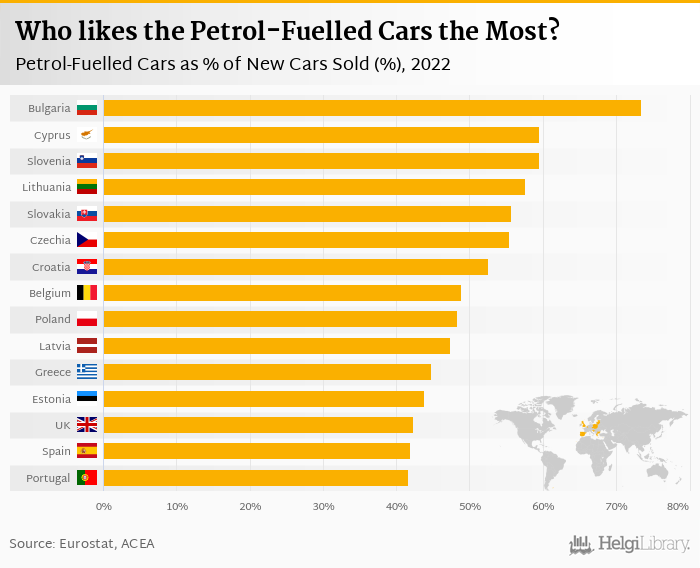
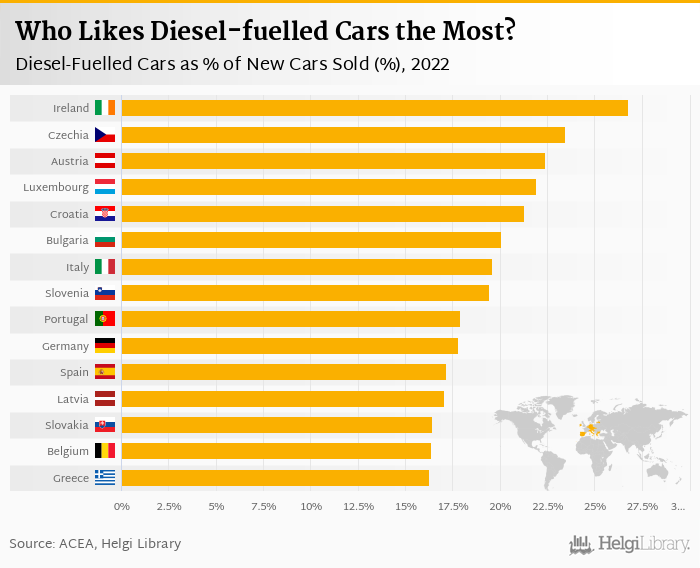
By contrast, Bulgaria ranked the highest in the number of petrol-fuelled as a proportion of new cars sold with 73.4%, followed by Cyprus and Slovenia. In terms of diesel-fuelled vehicles, Ireland ranked the highest with 26.8% followed by Czechia and Austria:
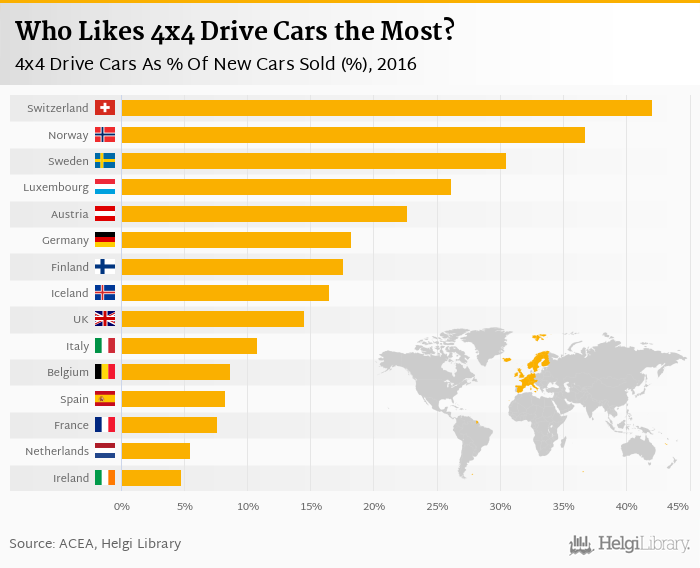
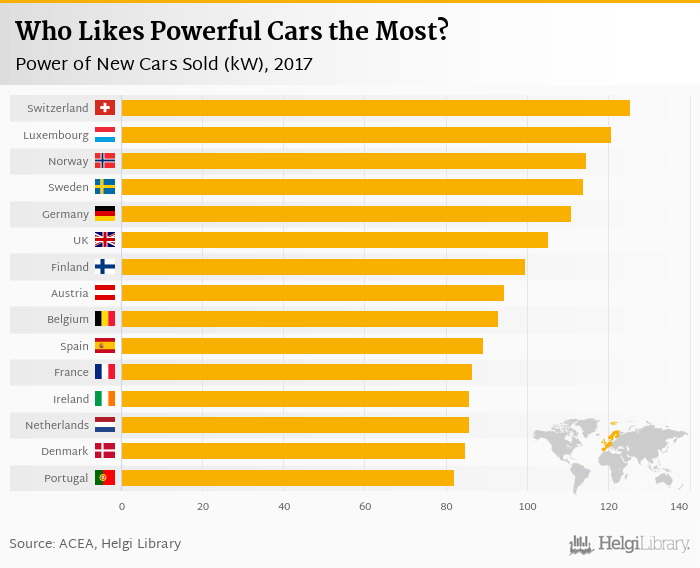
In 2016, Switzerland ranked the highest in 4x4 drive cars as a share of new cars sold with 42.1% followed by Norway and Sweden. Switzerland ranked the highest in the average power of new cars sold with 122 kW followed by Luxembourg and Sweden:
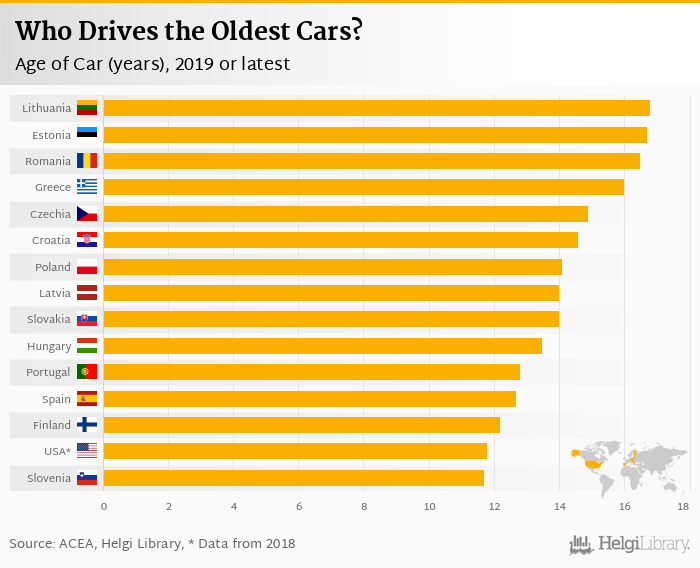
Based on the latest available data, Lithuania, Estonia and Romania were the countries with the oldest average age of passenger cars. The average age was an ancient 16.8 years in Lithuania, 16.7 years years for Estonia and 16.5 years years in Romania. On the other end of the scale was Austria with 8.30 years years, the United Kingdom with 8.00 years years and Luxembourg with 6.50 years years.
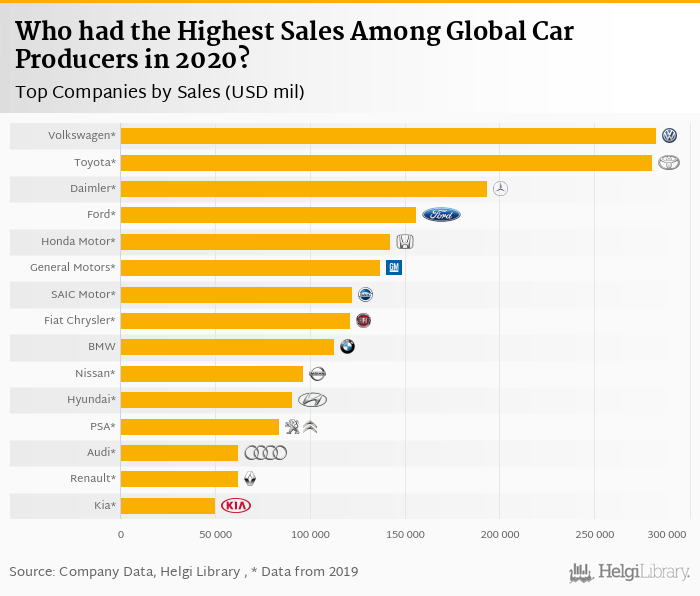
Based on a comparison of 27 firms among Global Car Producers, Volkswagen Group generated the highest sales in 2019 followed by Toyota Motor Corporation and Daimler Group. At the same time, Toyota Motor Corporation had the highest market value followed by Volkswagen Group and Tesla Inc.:

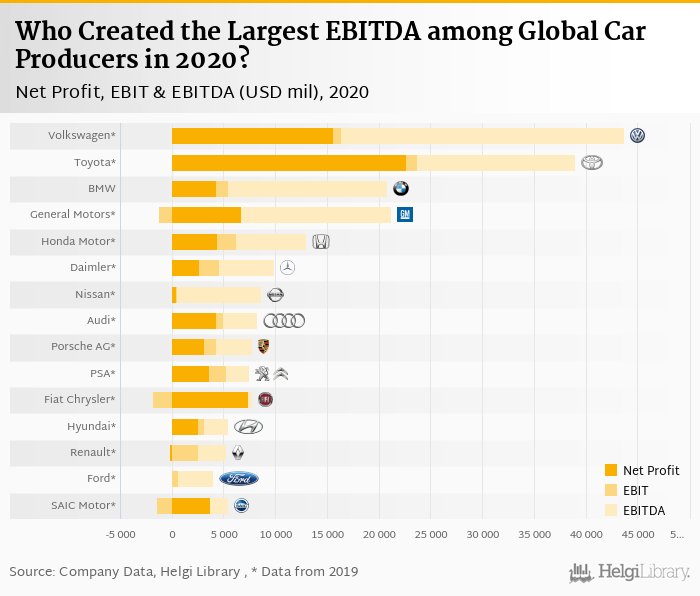
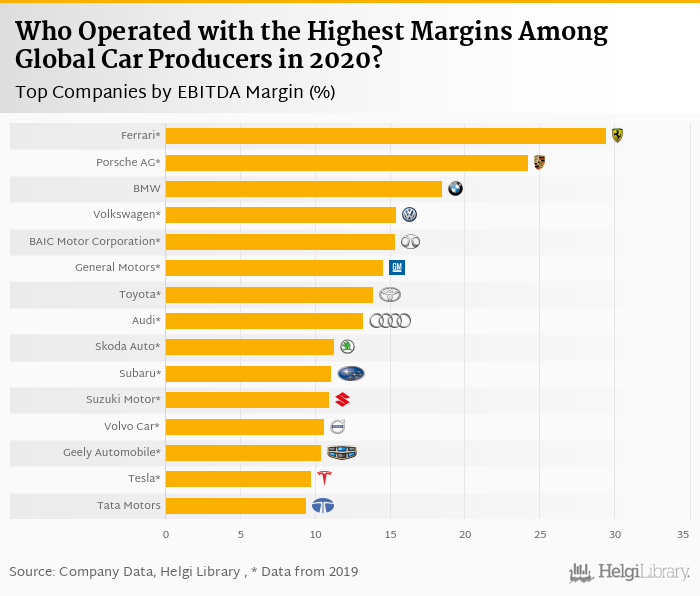
Volkswagen Group generated the highest earnings before interest costs, taxes and depreciation (so called EBITDA) in 2019 followed by Toyota Motor Corporation and General Motors. At the same time, Ferrari generated the highest EBITDA Margin followed by Porsche AG and BMW Group.
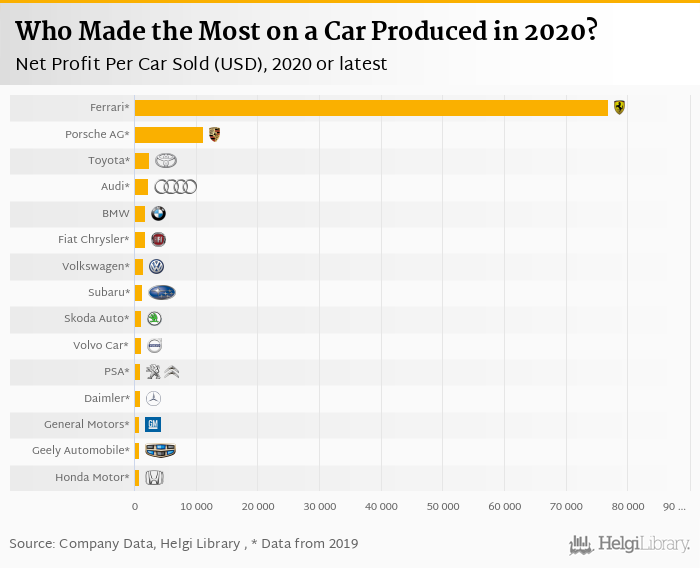
Ferrari produced the highest net profit per car sold in 2019 followed by Porsche AG and Toyota Motor Corporation. Ferrari made a net profit of USD 77,831 for each car sold, down 21.7% compared to the previous year.
