By Helgi Library - February 19, 2020
UBI Banca made a net profit of EUR 111 mil in the fourth quarter of 2019, up 165% when compared to the same period of last year. ...
By Helgi Library - February 19, 2020
UBI Banca's non-performing loans reached 7.80% of total loans at the end of 2019-12-31, down from 10.4% compared to the previous ...
By Helgi Library - February 19, 2020
UBI Banca employed 19,940 persons in 2019-12-31, down 0.939% when compared to the previous year. Historically, the bank's workfo...
| Profit Statement | 2017 | 2018 | 2019 | |
| Net Interest Income | EUR mil | 1,665 | 1,898 | 1,733 |
| Net Fee Income | EUR mil | 1,547 | 1,581 | ... |
| Other Income | EUR mil | 608 | 437 | ... |
| Total Revenues | EUR mil | 3,820 | 3,916 | 3,598 |
| Staff Cost | EUR mil | 1,542 | 1,546 | 1,428 |
| Operating Profit | EUR mil | 1,309 | 1,289 | 1,353 |
| Provisions | EUR mil | 728 | 639 | 744 |
| Net Profit | EUR mil | 236 | 302 | 353 |
| Balance Sheet | 2017 | 2018 | 2019 | |
| Interbank Loans | EUR mil | 7,821 | 10,066 | 11,740 |
| Customer Loans | EUR mil | 91,977 | 88,988 | 84,564 |
| Total Assets | EUR mil | 127,376 | 125,306 | 126,525 |
| Shareholders' Equity | EUR mil | 10,005 | 9,214 | 9,547 |
| Interbank Borrowing | EUR mil | 17,312 | 17,885 | 14,923 |
| Customer Deposits | EUR mil | 68,268 | 68,182 | 72,577 |
| Issued Debt Securities | EUR mil | 26,015 | 23,790 | 22,850 |
| Ratios | 2017 | 2018 | 2019 | |
| ROE | % | 2.48 | 3.15 | 3.76 |
| ROA | % | 1.51 | 1.42 | 1.56 |
| Costs (As % Of Assets) | % | 2.89 | 2.90 | 2.59 |
| Costs (As % Of Income) | % | 65.7 | 67.1 | 62.4 |
| Capital Adequacy Ratio | % | 14.1 | 13.8 | 15.9 |
| Net Interest Margin | % | 1.39 | 1.50 | 1.38 |
| Loans (As % Of Deposits) | % | 135 | 131 | 117 |
| NPLs (As % Of Loans) | % | 12.7 | 10.4 | 7.80 |
| Provisions (As % Of NPLs) | % | 45.2 | 44.2 | 45.7 |
| Valuation | 2017 | 2018 | 2019 | |
| Price/Earnings (P/E) | 17.6 | 9.54 | 9.37 | |
| Price/Book Value (P/BV) | 0.415 | 0.313 | 0.346 | |
| Dividend Yield | % | 3.02 | 4.74 | 4.46 |
| Earnings Per Share (EPS) | EUR | 0.207 | 0.265 | 0.311 |
| Book Value Per Share | EUR | 8.78 | 8.09 | 8.41 |
| Dividend Per Share | EUR | 0.110 | 0.120 | 0.130 |
Get all company financials in excel:
| summary | Unit | 2002 | 2003 | 2004 | 2005 | 2006 | 2007 | 2008 | 2009 | 2010 | 2011 | 2012 | 2013 | 2014 | 2015 | 2016 | 2017 | 2018 | 2019 |
| income statement | |||||||||||||||||||
| Net Interest Income | EUR mil | 1,761 | 1,828 | 1,641 | 1,508 | 1,665 | |||||||||||||
| Total Revenues | EUR mil | 3,731 | 3,759 | 3,643 | 3,366 | 3,820 | |||||||||||||
| Operating Profit | EUR mil | 1,348 | 1,223 | 1,224 | 1,121 | 1,309 | |||||||||||||
| Net Profit | EUR mil | 292 | 140 | 113 | -444 | 236 | |||||||||||||
| balance sheet | |||||||||||||||||||
| Interbank Loans | EUR mil | 4,149 | 3,881 | 4,200 | 3,841 | 7,821 | |||||||||||||
| Customer Loans | EUR mil | 88,403 | 85,103 | 83,816 | 81,733 | 91,977 | |||||||||||||
| Debt Securities | EUR mil | 21,384 | 23,127 | 19,717 | 17,243 | 16,772 | |||||||||||||
| Total Assets | EUR mil | 124,242 | 121,787 | 117,201 | 112,384 | 127,376 | |||||||||||||
| Shareholders' Equity | EUR mil | 11,181 | 10,359 | 10,518 | 9,062 | 10,005 | |||||||||||||
| Interbank Borrowing | EUR mil | 22,170 | 19,606 | 16,627 | 16,737 | 17,312 | |||||||||||||
| Customer Deposits | EUR mil | 44,946 | 45,922 | 49,092 | 53,621 | 68,268 | |||||||||||||
| Issued Debt Securities | EUR mil | 41,902 | 41,590 | 36,248 | 28,940 | 26,015 | |||||||||||||
| ratios | |||||||||||||||||||
| ROE | % | ... | 2.68 | 1.30 | 1.08 | -4.53 | 2.48 | ||||||||||||
| ROA | % | ... | 1.49 | 1.41 | 1.45 | 1.35 | 1.51 | ||||||||||||
| Costs (As % Of Assets) | % | ... | 2.64 | 2.92 | 2.86 | 2.71 | 2.89 | ||||||||||||
| Costs (As % Of Income) | % | 63.9 | 67.5 | 66.4 | 66.7 | 65.7 | |||||||||||||
| Capital Adequacy Ratio | % | 18.9 | 15.3 | 13.9 | 14.1 | 14.1 | |||||||||||||
| Net Interest Margin | % | ... | 1.37 | 1.49 | 1.37 | 1.31 | 1.39 | ||||||||||||
| Interest Income (As % Of Revenues) | % | 47.2 | 48.6 | 45.1 | 44.8 | 43.6 | |||||||||||||
| Fee Income (As % Of Revenues) | % | 31.8 | 32.6 | 35.7 | 39.7 | 40.5 | ... | ||||||||||||
| Staff Cost (As % Of Total Cost) | % | ... | ... | 56.1 | 55.7 | 57.5 | 71.2 | 61.4 | |||||||||||
| Equity (As % Of Assets) | % | 12.6 | 12.2 | 12.5 | 11.1 | 10.9 | |||||||||||||
| Loans (As % Of Deposits) | % | 197 | 185 | 171 | 152 | 135 | |||||||||||||
| Loans (As % Assets) | % | 71.2 | 69.9 | 71.5 | 72.7 | 72.2 | |||||||||||||
| NPLs (As % Of Loans) | % | ... | 13.7 | 14.6 | 15.3 | 14.5 | 12.7 | ||||||||||||
| Provisions (As % Of NPLs) | % | ... | 30.3 | 30.8 | 31.0 | 38.7 | 45.2 | ||||||||||||
| valuation | |||||||||||||||||||
| Market Capitalisation (End Of Period) | USD mil | ... | 6,126 | 6,491 | 6,065 | 2,681 | 5,016 | ||||||||||||
| Number Of Shares (Average) | mil | ... | ... | ... | ... | 944 | 944 | 945 | 952 | 1,140 | |||||||||
| Share Price (End Of Period) | EUR | ... | 4.70 | 5.68 | 5.91 | 2.49 | 3.65 | ||||||||||||
| Earnings Per Share (EPS) | EUR | ... | ... | ... | ... | 0.309 | 0.148 | 0.119 | -0.466 | 0.207 | |||||||||
| Book Value Per Share | EUR | ... | ... | ... | ... | 11.8 | 11.0 | 11.1 | 9.52 | 8.78 | |||||||||
| Dividend Per Share | EUR | 0.057 | 0.076 | 0.105 | 0.105 | 0.110 | |||||||||||||
| Price/Earnings (P/E) | ... | ... | ... | ... | 15.2 | 38.4 | 49.5 | ... | 17.6 | ||||||||||
| Price/Book Value (P/BV) | ... | ... | ... | ... | 0.397 | 0.518 | 0.531 | 0.262 | 0.415 | ||||||||||
| Dividend Yield | % | ... | 1.22 | 1.34 | 1.77 | 4.21 | 3.02 | ||||||||||||
| Earnings Per Share Growth | % | ... | ... | ... | ... | ... | ... | 105 | -52.1 | -19.3 | -491 | -144 | |||||||
| Book Value Per Share Growth | % | ... | 5.76 | -7.36 | 1.52 | -14.5 | -7.76 |
| income statement | Unit | 2002 | 2003 | 2004 | 2005 | 2006 | 2007 | 2008 | 2009 | 2010 | 2011 | 2012 | 2013 | 2014 | 2015 | 2016 | 2017 | 2018 | 2019 |
| income statement | |||||||||||||||||||
| Interest Income | EUR mil | 3,265 | 3,025 | 2,520 | 2,171 | 2,275 | ... | ||||||||||||
| Interest Cost | EUR mil | 1,504 | 1,197 | 878 | 663 | 610 | ... | ||||||||||||
| Net Interest Income | EUR mil | 1,761 | 1,828 | 1,641 | 1,508 | 1,665 | |||||||||||||
| Net Fee Income | EUR mil | 1,187 | 1,227 | 1,300 | 1,335 | 1,547 | ... | ||||||||||||
| Other Income | EUR mil | 783 | 704 | 702 | 524 | 608 | ... | ||||||||||||
| Total Revenues | EUR mil | 3,731 | 3,759 | 3,643 | 3,366 | 3,820 | |||||||||||||
| Staff Cost | EUR mil | ... | ... | 1,338 | 1,413 | 1,392 | 1,600 | 1,542 | |||||||||||
| Depreciation | EUR mil | ... | ... | 96.5 | 86.2 | 83.0 | 76.2 | 83.5 | ... | ||||||||||
| Other Cost | EUR mil | ... | ... | 949 | 1,037 | 945 | 570 | 885 | ... | ||||||||||
| Operating Cost | EUR mil | 2,383 | 2,536 | 2,419 | 2,246 | 2,511 | |||||||||||||
| Operating Profit | EUR mil | 1,348 | 1,223 | 1,224 | 1,121 | 1,309 | |||||||||||||
| Provisions | EUR mil | 943 | 929 | 803 | 1,566 | 728 | |||||||||||||
| Extra and Other Cost | EUR mil | 156 | 145 | 86.5 | 127 | 174 | |||||||||||||
| Pre-Tax Profit | EUR mil | 249 | 150 | 335 | -572 | 407 | |||||||||||||
| Tax | EUR mil | -66.5 | -12.4 | 194 | -113 | 144 | |||||||||||||
| Minorities | EUR mil | 23.3 | 22.2 | 27.7 | -14.9 | 26.4 | |||||||||||||
| Net Profit | EUR mil | 292 | 140 | 113 | -444 | 236 | |||||||||||||
| Dividends | EUR mil | ... | 54.0 | 72.0 | 99.0 | 107 | 126 | ||||||||||||
| growth rates | |||||||||||||||||||
| Net Interest Income Growth | % | ... | -9.56 | 3.82 | -10.2 | -8.15 | 10.4 | ||||||||||||
| Net Fee Income Growth | % | ... | 0.445 | 3.33 | 5.99 | 2.69 | 15.9 | ... | |||||||||||
| Total Revenue Growth | % | ... | -0.863 | 0.748 | -3.08 | -7.60 | 13.5 | ||||||||||||
| Operating Cost Growth | % | ... | -5.12 | 6.42 | -4.61 | -7.19 | 11.8 | ||||||||||||
| Operating Profit Growth | % | ... | 7.67 | -9.28 | 0.085 | -8.42 | 16.8 | ||||||||||||
| Pre-Tax Profit Growth | % | ... | -9.93 | -39.9 | 124 | -271 | -171 | ||||||||||||
| Net Profit Growth | % | ... | 105 | -52.1 | -19.3 | -494 | -153 |
| balance sheet | Unit | 2002 | 2003 | 2004 | 2005 | 2006 | 2007 | 2008 | 2009 | 2010 | 2011 | 2012 | 2013 | 2014 | 2015 | 2016 | 2017 | 2018 | 2019 |
| balance sheet | |||||||||||||||||||
| Cash | EUR mil | 590 | 598 | 530 | 519 | 812 | |||||||||||||
| Interbank Loans | EUR mil | 4,149 | 3,881 | 4,200 | 3,841 | 7,821 | |||||||||||||
| Customer Loans | EUR mil | 88,403 | 85,103 | 83,816 | 81,733 | 91,977 | |||||||||||||
| Retail Loans | EUR mil | ... | ... | ... | ... | ... | ... | ... | ... | ... | ... | ... | ... | ... | ... | 80,215 | ... | ||
| Mortgage Loans | EUR mil | ... | ... | ... | ... | ... | ... | ... | ... | ... | ... | ... | ... | ... | ... | ... | 61,700 | ... | |
| Consumer Loans | EUR mil | ... | ... | ... | ... | ... | ... | ... | ... | ... | ... | ... | ... | ... | ... | ... | 18,515 | ... | |
| Corporate Loans | EUR mil | ... | ... | ... | ... | ... | ... | ... | ... | ... | ... | ... | ... | ... | ... | ... | ... | ... | |
| Debt Securities | EUR mil | 21,384 | 23,127 | 19,717 | 17,243 | 16,772 | |||||||||||||
| Fixed Assets | EUR mil | 1,798 | 1,729 | 1,744 | 1,648 | 1,812 | |||||||||||||
| Intangible Assets | EUR mil | 2,919 | 1,777 | 1,757 | 1,696 | 1,728 | |||||||||||||
| Goodwill | EUR mil | ... | 2,512 | 1,465 | 1,465 | 1,465 | 1,465 | ||||||||||||
| Total Assets | EUR mil | 124,242 | 121,787 | 117,201 | 112,384 | 127,376 | |||||||||||||
| Shareholders' Equity | EUR mil | 11,181 | 10,359 | 10,518 | 9,062 | 10,005 | |||||||||||||
| Of Which Minority Interest | EUR mil | 842 | 555 | 536 | 72.0 | 79.7 | |||||||||||||
| Liabilities | EUR mil | 113,060 | 111,428 | 106,683 | 103,322 | 117,371 | |||||||||||||
| Interbank Borrowing | EUR mil | 22,170 | 19,606 | 16,627 | 16,737 | 17,312 | |||||||||||||
| Customer Deposits | EUR mil | 44,946 | 45,922 | 49,092 | 53,621 | 68,268 | |||||||||||||
| Sight Deposits | EUR mil | ... | 42,627 | 44,317 | 47,703 | 52,404 | 64,258 | ... | |||||||||||
| Term Deposits | EUR mil | ... | 1,014 | 429 | 183 | 125 | 2,365 | ... | |||||||||||
| Issued Debt Securities | EUR mil | 41,902 | 41,590 | 36,248 | 28,940 | 26,015 | |||||||||||||
| Subordinated Debt | EUR mil | ... | ... | ... | ... | ... | ... | ... | ... | ... | ... | ... | ... | ... | ... | ... | ... | ... | |
| Other Liabilities | EUR mil | 4,043 | 4,310 | 4,716 | 4,024 | 5,777 | |||||||||||||
| asset quality | |||||||||||||||||||
| Non-Performing Loans | EUR mil | ... | 12,674 | 13,049 | 13,434 | 12,521 | 12,414 | ||||||||||||
| Gross Loans | EUR mil | ... | 92,246 | 89,126 | 87,978 | 86,578 | 97,585 | ||||||||||||
| Total Provisions | EUR mil | ... | 3,844 | 4,023 | 4,162 | 4,845 | 5,608 | ||||||||||||
| growth rates | |||||||||||||||||||
| Customer Loan Growth | % | ... | -4.19 | -3.73 | -1.51 | -2.48 | 12.5 | ||||||||||||
| Retail Loan Growth | % | ... | ... | ... | ... | ... | ... | ... | ... | ... | ... | ... | ... | ... | ... | ... | ... | ... | |
| Mortgage Loan Growth | % | ... | ... | ... | ... | ... | ... | ... | ... | ... | ... | ... | ... | ... | ... | ... | ... | ... | |
| Consumer Loan Growth | % | ... | ... | ... | ... | ... | ... | ... | ... | ... | ... | ... | ... | ... | ... | ... | ... | ... | |
| Total Asset Growth | % | ... | -6.19 | -1.98 | -3.77 | -4.11 | 13.3 | ||||||||||||
| Shareholders' Equity Growth | % | ... | 5.71 | -7.35 | 1.53 | -13.8 | 10.4 | ||||||||||||
| Customer Deposit Growth | % | ... | -9.17 | 2.17 | 6.90 | 9.23 | 27.3 |
| ratios | Unit | 2002 | 2003 | 2004 | 2005 | 2006 | 2007 | 2008 | 2009 | 2010 | 2011 | 2012 | 2013 | 2014 | 2015 | 2016 | 2017 | 2018 | 2019 |
| ratios | |||||||||||||||||||
| ROE | % | ... | 2.68 | 1.30 | 1.08 | -4.53 | 2.48 | ||||||||||||
| ROA | % | ... | 1.49 | 1.41 | 1.45 | 1.35 | 1.51 | ||||||||||||
| Costs (As % Of Assets) | % | ... | 2.64 | 2.92 | 2.86 | 2.71 | 2.89 | ||||||||||||
| Costs (As % Of Income) | % | 63.9 | 67.5 | 66.4 | 66.7 | 65.7 | |||||||||||||
| Capital Adequacy Ratio | % | 18.9 | 15.3 | 13.9 | 14.1 | 14.1 | |||||||||||||
| Tier 1 Ratio | % | 13.2 | 12.3 | 12.1 | 11.5 | 11.6 | |||||||||||||
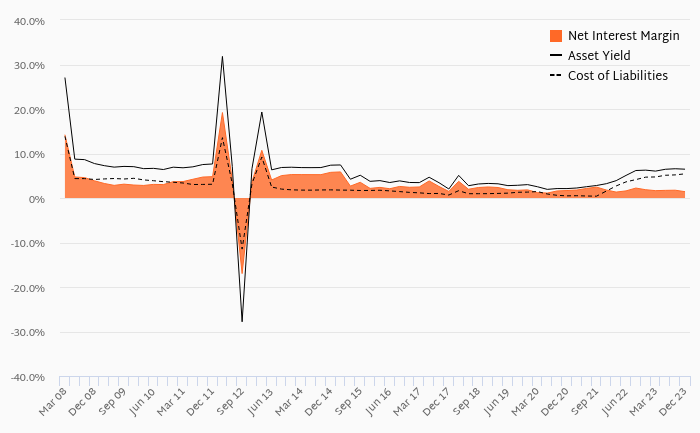
| Net Interest Margin | % | ... | 1.37 | 1.49 | 1.37 | 1.31 | 1.39 | ||||||||||||
| Interest Spread | % | ... | 1.26 | 1.39 | 1.30 | 1.26 | 1.34 | ... | |||||||||||
| Asset Yield | % | ... | 2.54 | 2.46 | 2.11 | 1.89 | 1.90 | ||||||||||||
| Cost Of Liabilities | % | ... | 1.28 | 1.07 | 0.805 | 0.632 | 0.553 | ... | |||||||||||
| Payout Ratio | % | ... | 18.5 | 51.5 | 87.8 | -24.1 | 53.3 | ||||||||||||
| Interest Income (As % Of Revenues) | % | 47.2 | 48.6 | 45.1 | 44.8 | 43.6 | |||||||||||||
| Fee Income (As % Of Revenues) | % | 31.8 | 32.6 | 35.7 | 39.7 | 40.5 | ... | ||||||||||||
| Other Income (As % Of Revenues) | % | 21.0 | 18.7 | 19.3 | 15.6 | 15.9 | ... | ||||||||||||
| Cost Per Employee | USD per month | ... | ... | 8,061 | 8,373 | 7,729 | 8,139 | 6,615 | |||||||||||
| Cost Per Employee (Local Currency) | EUR per month | ... | ... | 6,072 | 6,495 | 6,743 | 7,592 | 5,891 | |||||||||||
| Staff Cost (As % Of Total Cost) | % | ... | ... | 56.1 | 55.7 | 57.5 | 71.2 | 61.4 | |||||||||||
| Equity (As % Of Assets) | % | 12.6 | 12.2 | 12.5 | 11.1 | 10.9 | |||||||||||||
| Loans (As % Of Deposits) | % | 197 | 185 | 171 | 152 | 135 | |||||||||||||
| Loans (As % Assets) | % | 71.2 | 69.9 | 71.5 | 72.7 | 72.2 | |||||||||||||
| NPLs (As % Of Loans) | % | ... | 13.7 | 14.6 | 15.3 | 14.5 | 12.7 | ||||||||||||
| Provisions (As % Of NPLs) | % | ... | 30.3 | 30.8 | 31.0 | 38.7 | 45.2 | ||||||||||||
| Provisions (As % Of Loans) | % | ... | 4.35 | 4.73 | 4.97 | 5.93 | 6.10 | ||||||||||||
| Cost of Provisions (As % Of Loans) | % | ... | 1.04 | 1.07 | 0.950 | 1.89 | 0.839 |
| other data | Unit | 2002 | 2003 | 2004 | 2005 | 2006 | 2007 | 2008 | 2009 | 2010 | 2011 | 2012 | 2013 | 2014 | 2015 | 2016 | 2017 | 2018 | 2019 |
| other data | |||||||||||||||||||
| Branches | 1,731 | 1,676 | 1,560 | 1,524 | 1,838 | ||||||||||||||
| Employees | 18,358 | 18,132 | 17,200 | 17,560 | 21,818 | ||||||||||||||
| Sight (As % Of Customer Deposits) | % | ... | 94.8 | 96.5 | 97.2 | 97.7 | 94.1 | ... | |||||||||||
| Risk-Weighted Assets | EUR mil | ... | ... | ... | ... | 61,046 | 61,733 | 61,345 | 59,484 | 67,054 | ... | ||||||||
| Return on Loans | % | 0.323 | 0.161 | 0.133 | -0.536 | 0.272 | |||||||||||||
| Operating Profit (As % of Loans) | % | ... | 1.49 | 1.41 | 1.45 | 1.35 | 1.51 | ||||||||||||
| Costs (As % Of Loans) | % | ... | 2.64 | 2.92 | 2.86 | 2.71 | 2.89 | ||||||||||||
| Equity (As % Of Loans) | % | 12.6 | 12.2 | 12.5 | 11.1 | 10.9 |
Get all company financials in excel:


By Helgi Library - February 19, 2020
UBI Banca stock traded at EUR 2.91 per share at the end fourth quarter of 2019 implying a market capitalization of USD 3,711 mil. Since the end of 4Q2014, the stock has depreciated by -48.7 % implying an annual average growth of -12.5 %. In absolute terms, the value o...
By Helgi Library - February 19, 2020
UBI Banca's capital adequacy ratio reached 15.9% at the end of fourth quarter of 2019, up from 15.6% when compared to the previous quarter. Historically, the bank’s capital ratio hit an all time high of 19.3% in 3Q2013 and an all time low of 9.82% in 3Q2006. ...
By Helgi Library - February 19, 2020
UBI Banca stock traded at EUR 2.91 per share at the end of fourth quarter of 2019 implying a market capitalization of USD 3,711 mil. Over the last five years, the stock has depreciated by 48.7 implying an annual average growth of -12.5% In absolute terms,...
By Helgi Library - February 19, 2020
UBI Banca's Equity reached 12.5% of total assets in the 4Q2019, up from 12.1% for the previous year. As a share of net customer loans, the ratio amounted to 22.4% at the end of the fourth quarter of 2019. ...
By Helgi Library - February 19, 2020
UBI Banca's customer loan growth reached -4.97% in 2019-12-31, down from -3.25% compared to the previous year. Historically, the bank’s loans growth reached an all time high of 83.4% in 2007-03-31 and an all time low of -7.17% in 2012-06-30. In the last d...
By Helgi Library - February 19, 2020
UBI Banca's capital adequacy ratio reached 15.9% at the end of 2019, up from 13.8% compared to the previous year. Historically, the bank’s capital ratio hit an all time high of 18.9% in 2013 and an all time low of 9.78% in 2003. The Tier 1 ratio amounted to ...
By Helgi Library - February 19, 2020
UBI Banca's non-performing loans reached 7.80% of total loans at the end of 2019, down from 10.4% compared to the previous year. Historically, the NPL ratio hit an all time high of 15.3% in 2015 and an all time low of 0.988% in 2006. Provision coverage amou...
By Helgi Library - February 19, 2020
UBI Banca made a net profit of EUR 353 mil under revenues of EUR 3,598 mil in 2019, up 16.676751344899% and -8.1197388852566% respectively compared to the previous year. Historically, the bank’s net profit reached an all time high of EUR 951 mil in 2006 and an all time l...
By Helgi Library - February 19, 2020
UBI Banca stock traded at EUR 2.91 per share at the end of 2019 implying a market capitalization of USD 3,711 mil. Since the end of 2014, the stock has depreciated by -48.7 % implying an annual average growth of -12.5 %. In absolute terms, the value of the company ...
By Helgi Library - February 19, 2020
UBI Banca employed 19,940 persons in 2019, up 1.12% when compared to the previous year. Historically, the bank's workforce hit an all time high of 21,818 persons in 2017 and an all time low of 14,563 in 2004. Average cost reached USD 6,988 per month per employee,...

 Helgi Library