By Helgi Library - May 15, 2024
Banco do Brasil Austria's net interest margin amounted to 1.19% in 2022, up from 0.796% compared to the previous year. His...
By Helgi Library - May 15, 2024
Banco do Brasil Austria made a net profit of EUR 0.551 mil under revenues of EUR 17.7 mil in 2022, up 105% and 25.2% respectively com...
By Helgi Library - May 15, 2024
's customer loan growth reached in, A PHP Error was encountered Severity: Warning Message: A non-numeric value encountered Filename: sr...
| Profit Statement | 2020 | 2021 | 2022 | |
| Net Interest Income | EUR mil | 6.87 | 7.41 | 10.9 |
| Net Fee Income | EUR mil | 5.14 | 4.89 | 4.68 |
| Other Income | EUR mil | 1.50 | 1.87 | 2.19 |
| Total Revenues | EUR mil | 13.5 | 14.2 | 17.7 |
| Staff Cost | EUR mil | 9.59 | 9.45 | 8.36 |
| Operating Profit | EUR mil | -2.84 | -9.66 | -0.499 |
| Provisions | EUR mil | 1.48 | 0.692 | -1.13 |
| Net Profit | EUR mil | -4.65 | -10.6 | 0.551 |
| Balance Sheet | 2020 | 2021 | 2022 | |
| Interbank Loans | EUR mil | 115 | 116 | 98.6 |
| Customer Loans | EUR mil | 487 | 502 | 469 |
| Investments | EUR mil | ... | ... | ... |
| Total Assets | EUR mil | 938 | 924 | 901 |
| Shareholders' Equity | EUR mil | 288 | 288 | 288 |
| Interbank Borrowing | EUR mil | 463 | 516 | 382 |
| Customer Deposits | EUR mil | 270 | 206 | 322 |
| Ratios | 2020 | 2021 | 2022 | |
| ROE | % | -1.61 | -3.69 | 0.191 |
| ROA | % | -0.464 | -1.14 | 0.060 |
| Costs (As % Of Assets) | % | 1.94 | 1.77 | 1.55 |
| Costs (As % Of Income) | % | 144 | 116 | 79.6 |
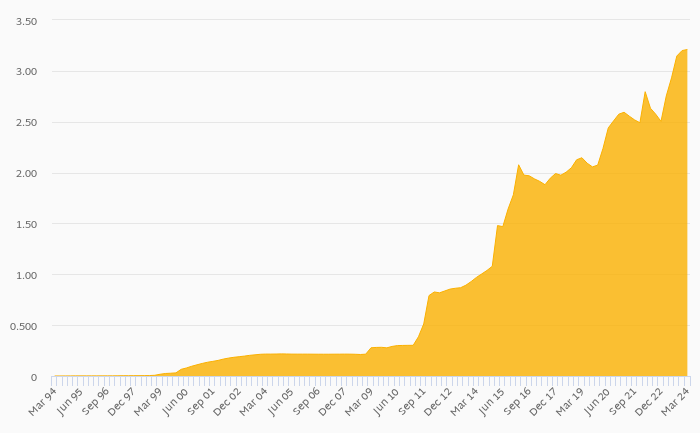
| Net Interest Margin | % | 0.685 | 0.796 | 1.19 |
| Loans (As % Of Deposits) | % | 180 | 243 | 146 |
| Growth Rates | 2020 | 2021 | 2022 | |
| Total Revenue Growth | % | -22.5 | 4.92 | 25.2 |
| Operating Cost Growth | % | -17.6 | -15.5 | -14.3 |
| Operating Profit Growth | % | -172 | 240 | -94.8 |
| Net Profit Growth | % | -1,030 | 129 | -105 |
| Customer Loan Growth | % | -18.2 | 3.01 | -6.54 |
| Total Asset Growth | % | -12.2 | -1.47 | -2.50 |
| Customer Deposit Growth | % | 28.0 | -23.7 | 56.1 |
| Shareholders' Equity Growth | % | < -0.001 | 0 | 0 |
Get all company financials in excel:
| summary | Unit | 2013 | 2014 | 2015 | 2016 | 2017 | 2018 | 2019 | 2020 | 2021 | 2022 |
| income statement | |||||||||||
| Net Interest Income | EUR mil | 22.5 | 17.5 | 11.9 | 7.33 | 6.87 | |||||
| Total Revenues | EUR mil | 36.6 | 30.9 | 22.7 | 17.4 | 13.5 | |||||
| Operating Profit | EUR mil | -22.0 | -61.0 | 12.6 | 3.92 | -2.84 | |||||
| Net Profit | EUR mil | -25.7 | -60.7 | 4.07 | 0.500 | -4.65 | |||||
| balance sheet | |||||||||||
| Interbank Loans | EUR mil | 207 | 128 | 51.3 | 129 | 115 | |||||
| Customer Loans | EUR mil | 1,293 | 800 | 649 | 595 | 487 | |||||
| Investments | EUR mil | ... | ... | ... | ... | ... | ... | ... | |||
| Total Assets | EUR mil | 1,756 | 1,338 | 1,105 | 1,068 | 938 | |||||
| Shareholders' Equity | EUR mil | 258 | 258 | 288 | 288 | 288 | |||||
| Interbank Borrowing | EUR mil | 1,231 | 960 | 676 | 645 | 463 | |||||
| Customer Deposits | EUR mil | 294 | 206 | 217 | 211 | 270 | |||||
| ratios | |||||||||||
| ROE | % | -9.96 | -23.5 | 1.49 | 0.173 | -1.61 | |||||
| ROA | % | -1.34 | -3.93 | 0.333 | 0.046 | -0.464 | |||||
| Costs (As % Of Assets) | % | 1.65 | 1.84 | 2.48 | 2.18 | 1.94 | |||||
| Costs (As % Of Income) | % | 86.4 | 91.9 | 133 | 136 | 144 | |||||
| Net Interest Margin | % | 1.18 | 1.13 | 0.974 | 0.675 | 0.685 | |||||
| Interest Income (As % Of Revenues) | % | 61.6 | 56.6 | 52.4 | 42.0 | 50.9 | |||||
| Fee Income (As % Of Revenues) | % | 26.4 | 30.7 | 37.7 | 44.3 | 38.0 | |||||
| Staff Cost (As % Of Total Cost) | % | 48.7 | 50.6 | 51.3 | 55.1 | 49.2 | |||||
| Equity (As % Of Assets) | % | 14.7 | 19.3 | 26.1 | 27.0 | 30.8 | |||||
| Loans (As % Of Deposits) | % | 440 | 388 | 298 | 282 | 180 | |||||
| Loans (As % Assets) | % | 73.6 | 59.8 | 58.7 | 55.8 | 52.0 |
| income statement | Unit | 2013 | 2014 | 2015 | 2016 | 2017 | 2018 | 2019 | 2020 | 2021 | 2022 |
| income statement | |||||||||||
| Interest Income | EUR mil | 47.4 | 33.1 | 21.7 | 16.8 | 13.2 | |||||
| Interest Cost | EUR mil | 24.9 | 15.6 | 9.80 | 9.49 | 6.33 | |||||
| Net Interest Income | EUR mil | 22.5 | 17.5 | 11.9 | 7.33 | 6.87 | |||||
| Net Fee Income | EUR mil | 9.68 | 9.50 | 8.57 | 7.72 | 5.14 | |||||
| Fee Income | EUR mil | 10.5 | 10.1 | 9.07 | 8.38 | 6.45 | |||||
| Fee Expense | EUR mil | 0.837 | 0.599 | 0.501 | 0.656 | 1.31 | |||||
| Other Income | EUR mil | 4.39 | 3.92 | 2.25 | 2.38 | 1.50 | |||||
| Total Revenues | EUR mil | 36.6 | 30.9 | 22.7 | 17.4 | 13.5 | |||||
| Staff Cost | EUR mil | 15.4 | 14.4 | 15.5 | 13.0 | 9.59 | |||||
| Depreciation | EUR mil | 0.863 | 0.950 | 0.764 | 0.878 | 0.771 | |||||
| Other Cost | EUR mil | 15.3 | 13.1 | 13.9 | 9.76 | 9.13 | |||||
| Operating Cost | EUR mil | 31.6 | 28.4 | 30.2 | 23.7 | 19.5 | |||||
| Operating Profit | EUR mil | -22.0 | -61.0 | 12.6 | 3.92 | -2.84 | |||||
| Provisions | EUR mil | 1.83 | 1.18 | 6.31 | ... | 1.48 | |||||
| Pre-Tax Profit | EUR mil | -23.8 | -62.2 | 6.24 | ... | -4.31 | |||||
| Tax | EUR mil | 1.88 | -1.46 | 2.17 | ... | 0.337 | |||||
| Net Profit | EUR mil | -25.7 | -60.7 | 4.07 | 0.500 | -4.65 | |||||
| Net Profit Avail. to Common | EUR mil | -25.7 | -60.7 | 4.07 | 0.500 | -4.65 | |||||
| growth rates | |||||||||||
| Net Interest Income Growth | % | ... | -25.6 | -22.4 | -31.9 | -38.4 | -6.25 | ||||
| Net Fee Income Growth | % | ... | 0.249 | -1.81 | -9.79 | -9.93 | -33.5 | ||||
| Total Revenue Growth | % | ... | -14.5 | -15.5 | -26.5 | -23.3 | -22.5 | ||||
| Operating Cost Growth | % | ... | 0.060 | -10.1 | 6.45 | -21.8 | -17.6 | ||||
| Operating Profit Growth | % | ... | 62.3 | 177 | -121 | -68.8 | -172 | ||||
| Pre-Tax Profit Growth | % | ... | 59.8 | 161 | -110 | ... | ... | ||||
| Net Profit Growth | % | ... | 36.1 | 136 | -107 | -87.7 | -1,030 |
| balance sheet | Unit | 2013 | 2014 | 2015 | 2016 | 2017 | 2018 | 2019 | 2020 | 2021 | 2022 |
| balance sheet | |||||||||||
| Cash & Cash Equivalents | EUR mil | 126 | 178 | 145 | 104 | 106 | |||||
| Interbank Loans | EUR mil | 207 | 128 | 51.3 | 129 | 115 | |||||
| Customer Loans | EUR mil | 1,293 | 800 | 649 | 595 | 487 | |||||
| Investments | EUR mil | ... | ... | ... | ... | ... | ... | ... | |||
| Property and Equipment | EUR mil | 1.52 | 0.874 | 1.02 | 0.826 | 0.500 | |||||
| Intangible Assets | EUR mil | 0.892 | 1.20 | 1.18 | 0.695 | 0.401 | |||||
| Total Assets | EUR mil | 1,756 | 1,338 | 1,105 | 1,068 | 938 | |||||
| Shareholders' Equity | EUR mil | 258 | 258 | 288 | 288 | 288 | |||||
| Of Which Minority Interest | EUR mil | 0 | 0 | 0 | 0 | 0 | |||||
| Liabilities | EUR mil | 1,498 | 1,080 | 817 | 779 | 649 | |||||
| Interbank Borrowing | EUR mil | 1,231 | 960 | 676 | 645 | 463 | |||||
| Customer Deposits | EUR mil | 294 | 206 | 217 | 211 | 270 | |||||
| growth rates | |||||||||||
| Customer Loan Growth | % | ... | -19.9 | -38.2 | -18.9 | -8.21 | -18.2 | ||||
| Total Asset Growth | % | ... | -15.4 | -23.8 | -17.4 | -3.42 | -12.2 | ||||
| Shareholders' Equity Growth | % | ... | 0 | 0 | 11.7 | 0.009 | < -0.001 | ||||
| Customer Deposit Growth | % | ... | 0.033 | -29.8 | 5.37 | -2.92 | 28.0 |
| ratios | Unit | 2013 | 2014 | 2015 | 2016 | 2017 | 2018 | 2019 | 2020 | 2021 | 2022 |
| ROE | % | -9.96 | -23.5 | 1.49 | 0.173 | -1.61 | |||||
| ROTE | % | -9.98 | -23.6 | 1.50 | 0.174 | -1.62 | |||||
| ROA | % | -1.34 | -3.93 | 0.333 | 0.046 | -0.464 | |||||
| Return on Loans | % | -1.77 | -5.80 | 0.562 | 0.080 | -0.859 | |||||
| Costs (As % Of Assets) | % | 1.65 | 1.84 | 2.48 | 2.18 | 1.94 | |||||
| Costs (As % Of Income) | % | 86.4 | 91.9 | 133 | 136 | 144 | |||||
| Costs (As % Of Loans) | % | 2.17 | 2.71 | 4.18 | 3.80 | 3.60 | |||||
| Costs (As % Of Loans & Deposits) | % | ... | 1.81 | 2.19 | 3.23 | 2.83 | 2.49 | ||||
| Net Interest Margin | % | 1.18 | 1.13 | 0.974 | 0.675 | 0.685 | |||||
| Interest Spread | % | 0.974 | 0.928 | 0.743 | 0.359 | 0.430 | |||||
| Asset Yield | % | 2.48 | 2.14 | 1.78 | 1.55 | 1.32 | |||||
| Cost Of Liabilities | % | 1.50 | 1.21 | 1.03 | 1.19 | 0.887 | |||||
| Interest Income (As % Of Revenues) | % | 61.6 | 56.6 | 52.4 | 42.0 | 50.9 | |||||
| Fee Income (As % Of Revenues) | % | 26.4 | 30.7 | 37.7 | 44.3 | 38.0 | |||||
| Other Income (As % Of Revenues) | % | 12.0 | 12.7 | 9.90 | 13.7 | 11.1 | |||||
| Staff Cost (As % Of Total Cost) | % | 48.7 | 50.6 | 51.3 | 55.1 | 49.2 | |||||
| Equity (As % Of Assets) | % | 14.7 | 19.3 | 26.1 | 27.0 | 30.8 | |||||
| Equity (As % Of Loans) | % | 20.0 | 32.3 | 44.4 | 48.4 | 59.2 | |||||
| Loans (As % Of Deposits) | % | 440 | 388 | 298 | 282 | 180 | |||||
| Loans (As % Assets) | % | 73.6 | 59.8 | 58.7 | 55.8 | 52.0 | |||||
| Cost of Provisions (As % Of Loans) | % | 0.126 | 0.113 | 0.872 | ... | 0.273 |
Get all company financials in excel:


Banco do Brasil Austria has been growing its revenues and asset by 0.591% and -5.51% a year on average in the last 3 years. Its loans and deposits have grown by -7.66% and 15.1% a year during that time and loans to deposits ratio reached 146% at the end of 2022. The company achieved an average return on equity of -1.70% in the last three years with net profit growing 3.28% a year on average. In terms of operating efficiency, its cost to income ratio reached 79.6% in 2022, compared to 113% average in the last three years.
Equity represented 32.0% of total assets or of loans at the end of 2022. Banco do Brasil Austria's non-performing loans were of total loans while provisions covered some of NPLs at the end of 2022.
 Helgi Library