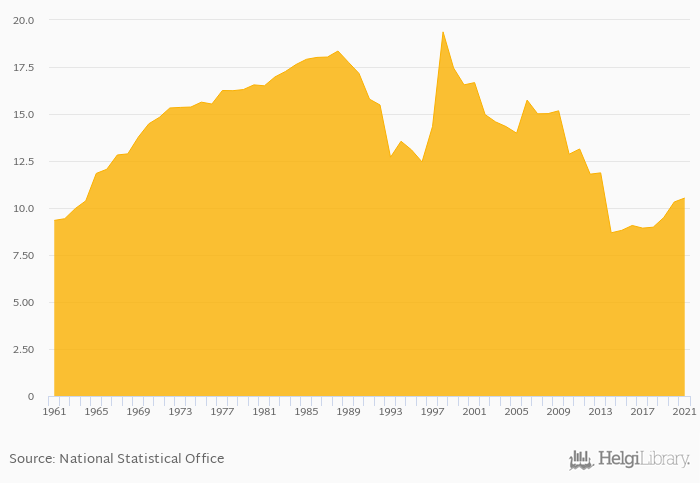
Egg consumption per capita rose 2.03% to 10.5 kg in Czechia in 2021, according to Faostat.
Historically, egg consumption per capita in Czechia reached an all time high of 19.4 kg in 1998 and an all time low of 8.68 kg in 2014. When compared to Czechia's main peers, egg consumption per capita in Austria amounted to 14.3 kg, 13.9 kg in Hungary, 9.80 kg in Poland and 11.4 kg in Slovakia in 2021.
Czechia has been ranked 59th within the group of 164 countries we follow in terms of egg consumption per capita, 35 places below the position seen 10 years ago.
| Egg Consumption Per Capita | Unit | 2001 | 2002 | 2003 | 2004 | 2005 | 2006 | 2007 | 2008 | 2009 | 2010 | 2011 | 2012 | 2013 | 2014 | 2015 | 2016 | 2017 | 2018 | 2019 | 2020 | 2021 |
| Austria | kg | 13.4 | 13.9 | 15.2 | 15.6 | 14.8 | ||||||||||||||||
| Czechia | kg | 8.81 | 9.07 | 8.93 | 8.98 | 9.49 | ||||||||||||||||
| Germany | kg | 13.9 | 14.5 | 14.4 | 14.9 | 17.5 | ||||||||||||||||
| Hungary | kg | 13.4 | 13.7 | 13.8 | 13.7 | 14.0 | ||||||||||||||||
| Italy | kg | 11.4 | 11.8 | 11.8 | 11.9 | 11.4 | ||||||||||||||||
| Poland | kg | 7.11 | 7.25 | 6.44 | 8.74 | 8.45 | ||||||||||||||||
| Russia | kg | 15.5 | 15.7 | 16.1 | 16.5 | 16.7 | ||||||||||||||||
| Slovakia | kg | 13.1 | 13.8 | 15.5 | 15.4 | 15.3 | ||||||||||||||||
| Switzerland | kg | 12.2 | 12.1 | 12.2 | 12.3 | 12.6 | ||||||||||||||||
| Ukraine | kg | 15.7 | 14.6 | 14.3 | 17.3 | 18.5 |
 Helgi Library